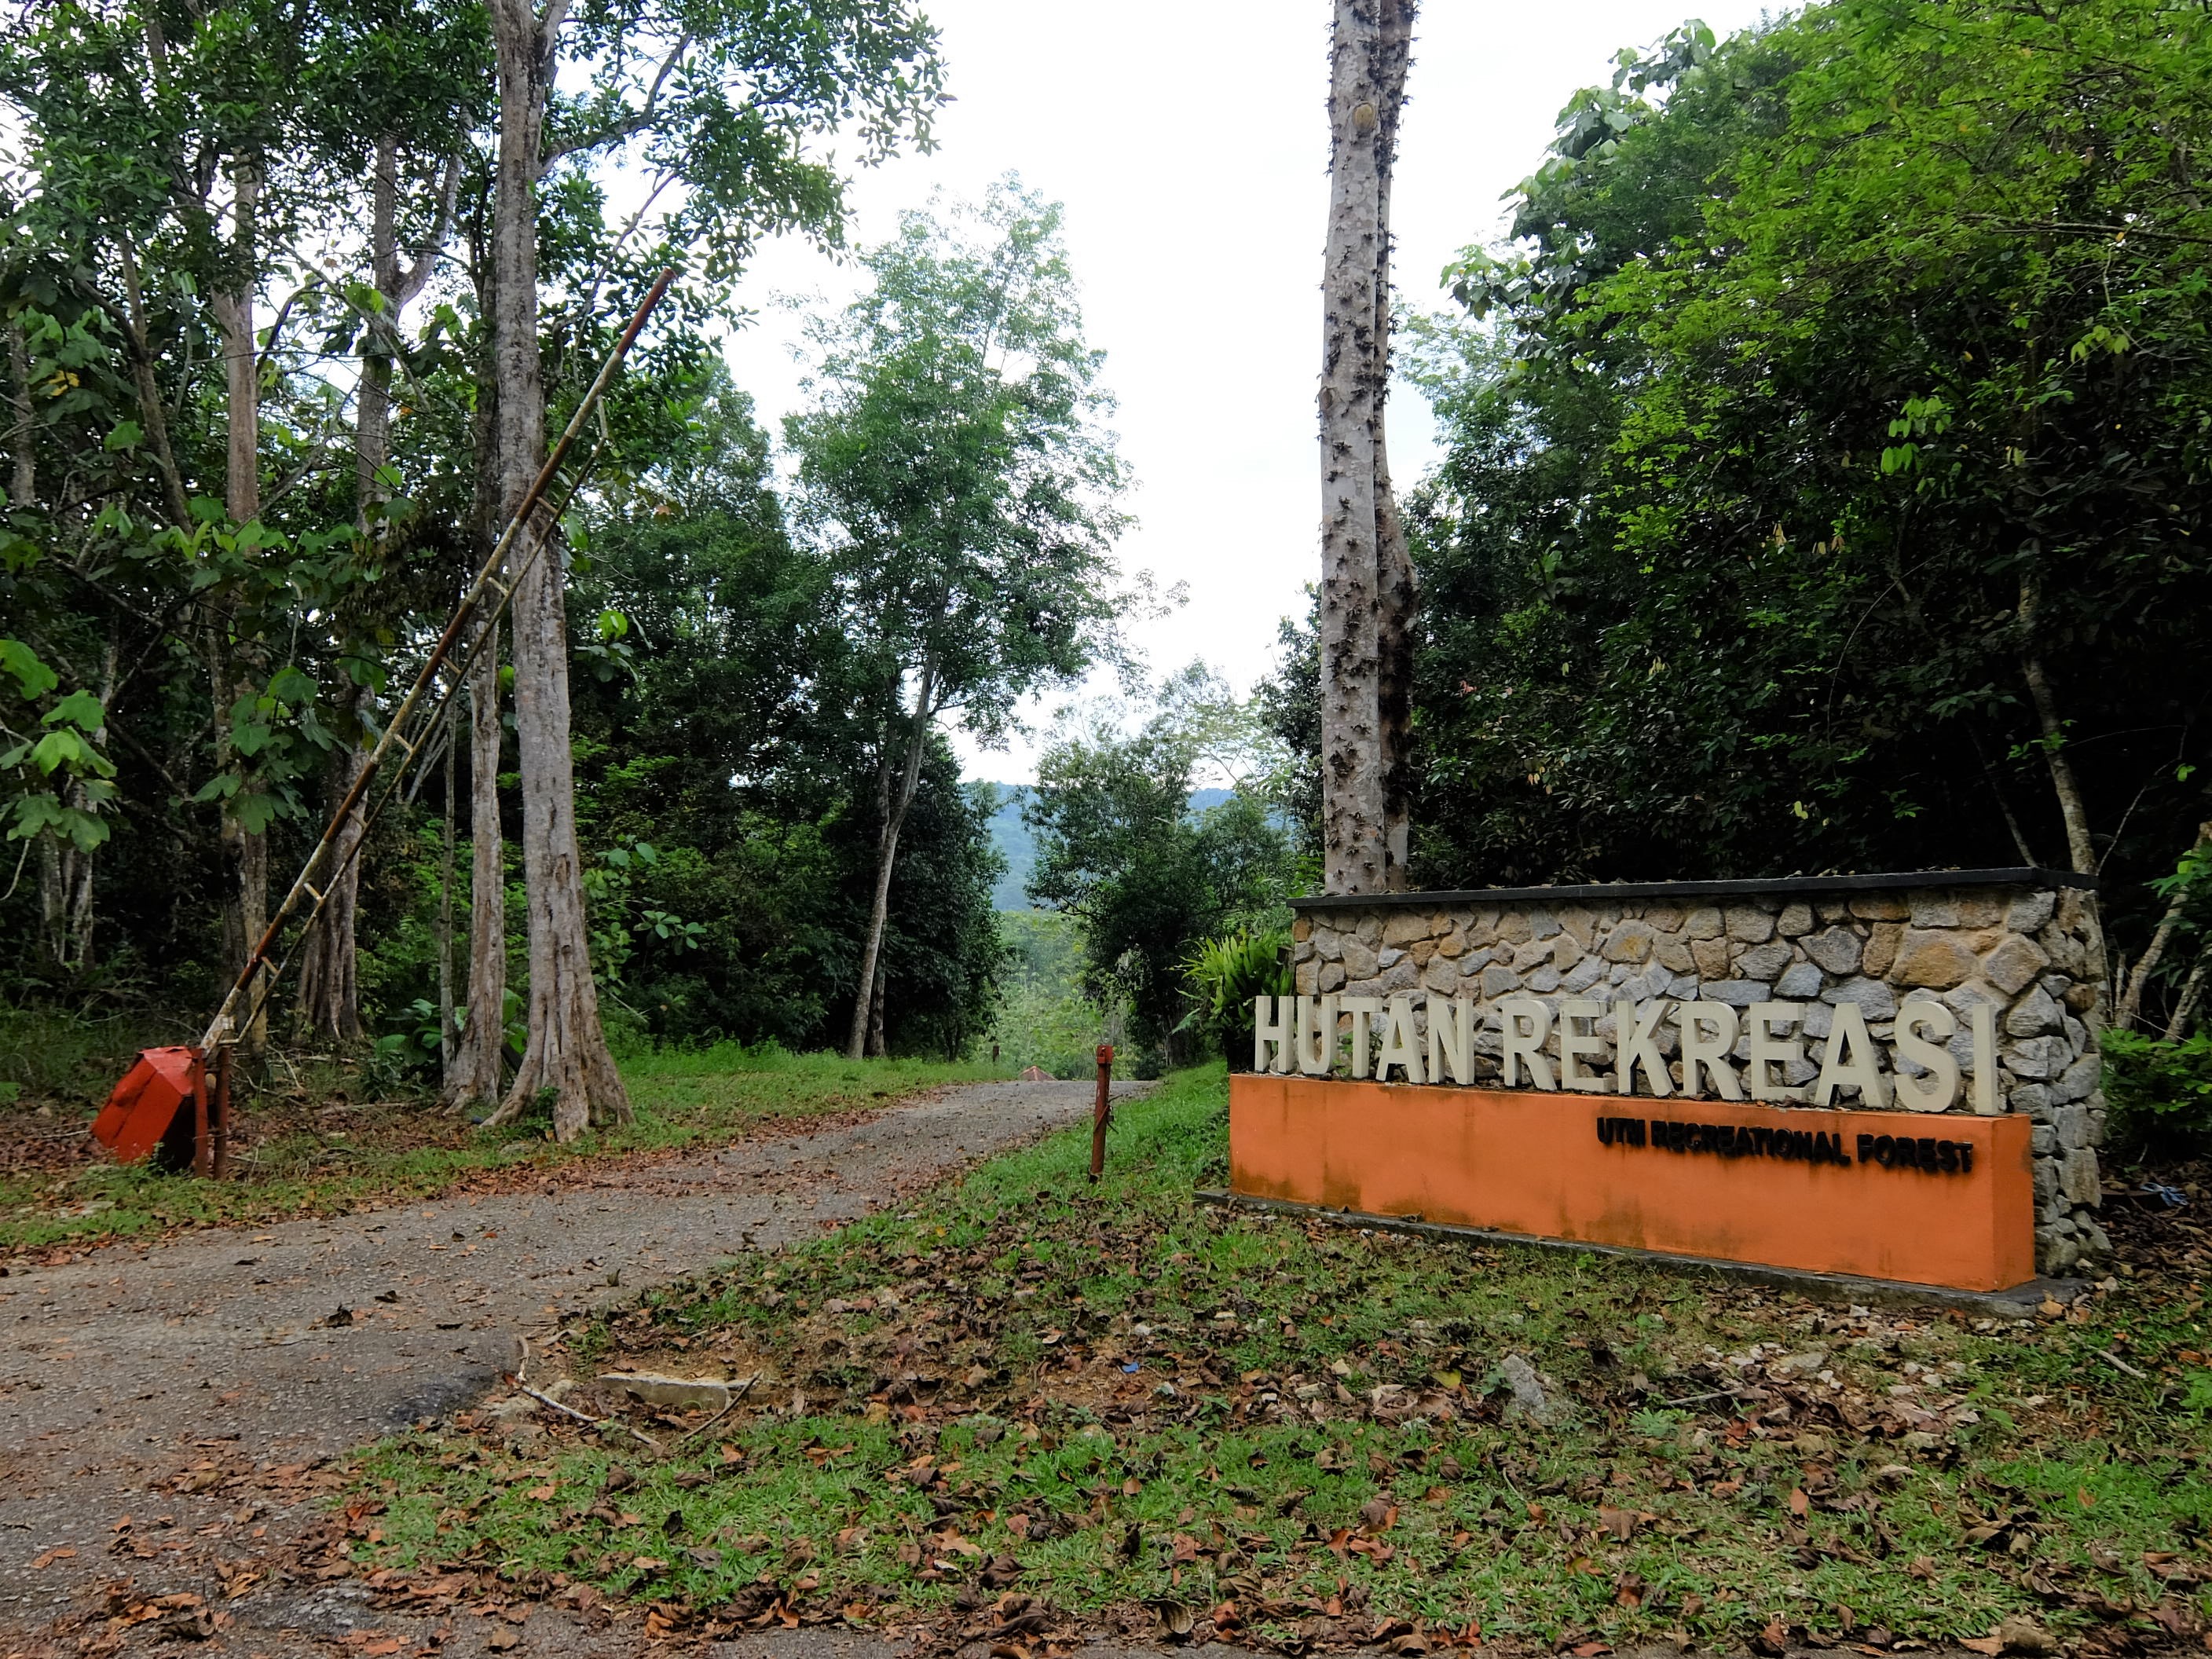
Tree Distribution of UTM Recreational Forest
Discover the Tree Distribution of UTM Recreational Forest –
Mapping Nature's Diversity.
About Us
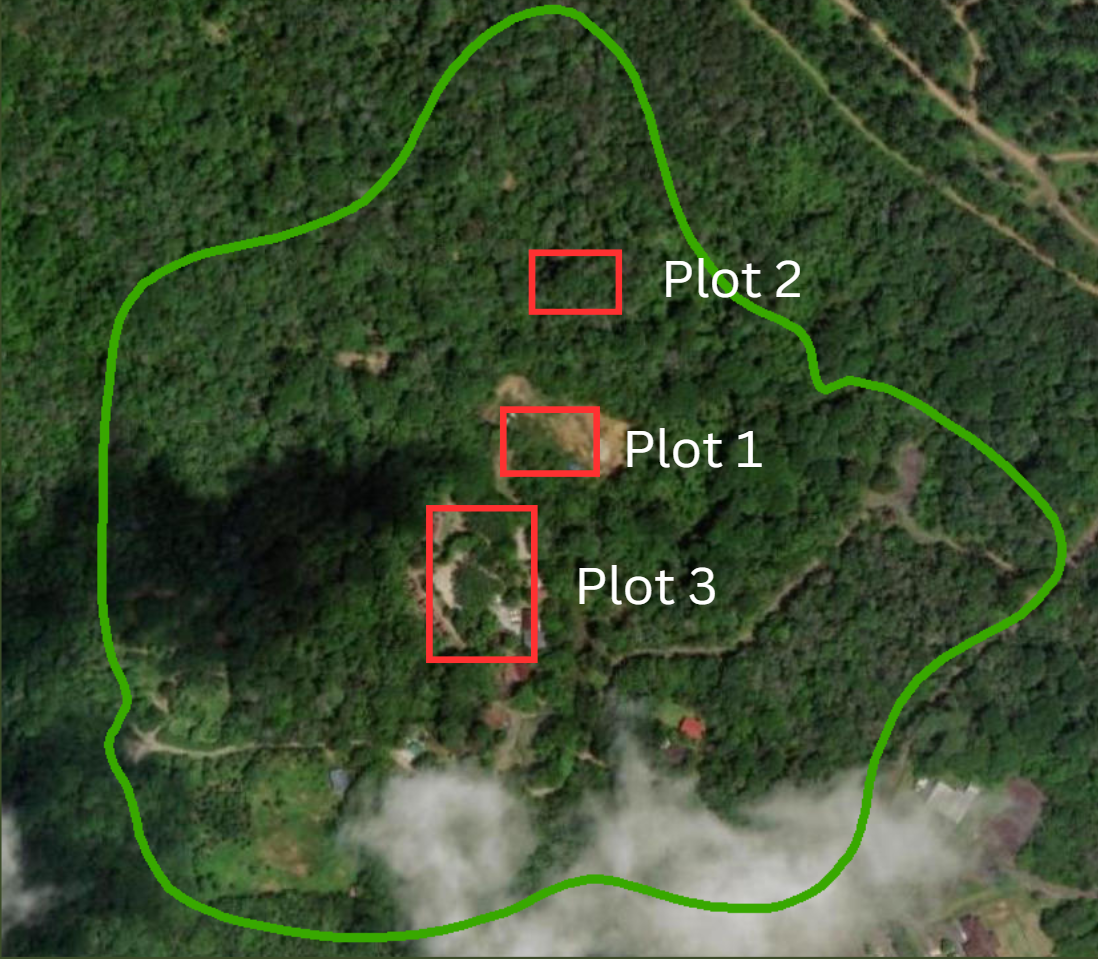
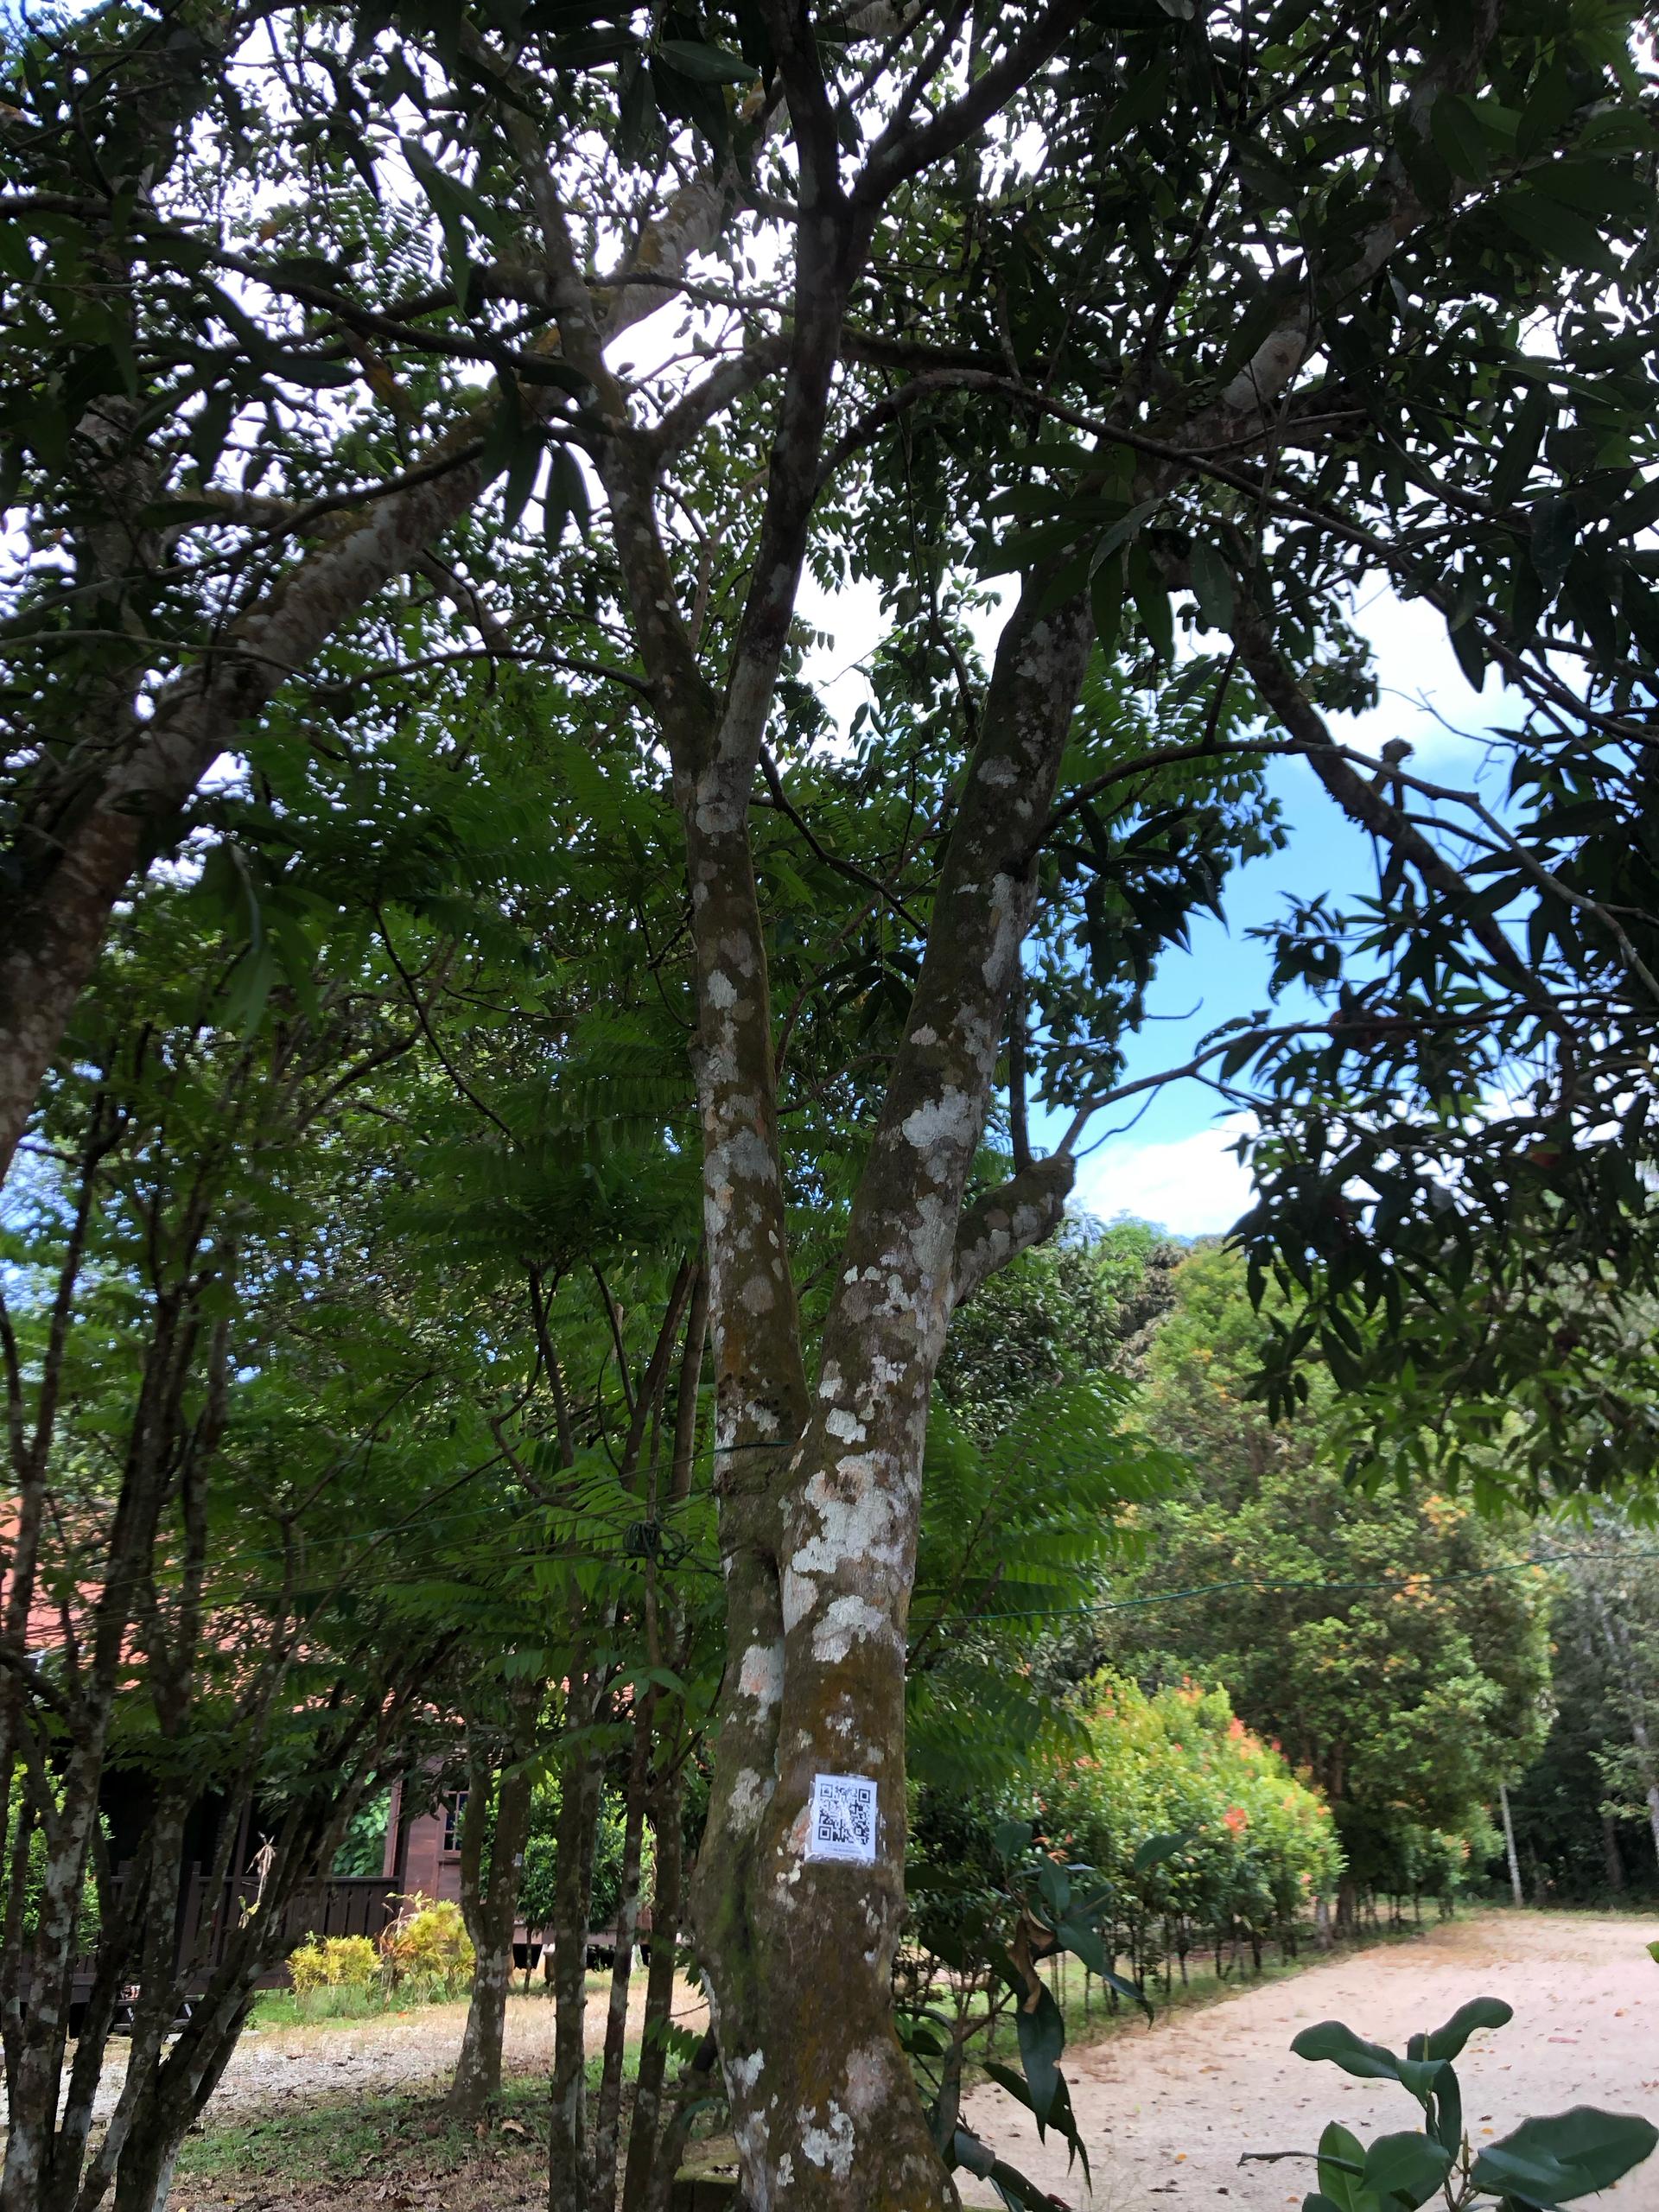
Tree Location Mapping was conducted using GPS handheld devices and RTK, with a base station set up on Geodetic 06 UTM. A total of 7 GCP and 2 Center Plots were recorded.
Species identification was performed using PlantNet, iNaturalist, and Google Lens.
The GeoTrees application was used to record geographic coordinates of trees, along with physical attributes such as tree height, circumference, and DBH, as well as species classification.
Processing and analysis included mapping tree height density and DBH density in Plots 1, 2, and 3, alongside Point Pattern Analysis (Quadrant Analysis) in Plots 1 and 2.
Hectare of UTM Recreational Forest
Total of Flora can be found inside study area
Known Type of Flora
Known Classification of Flora
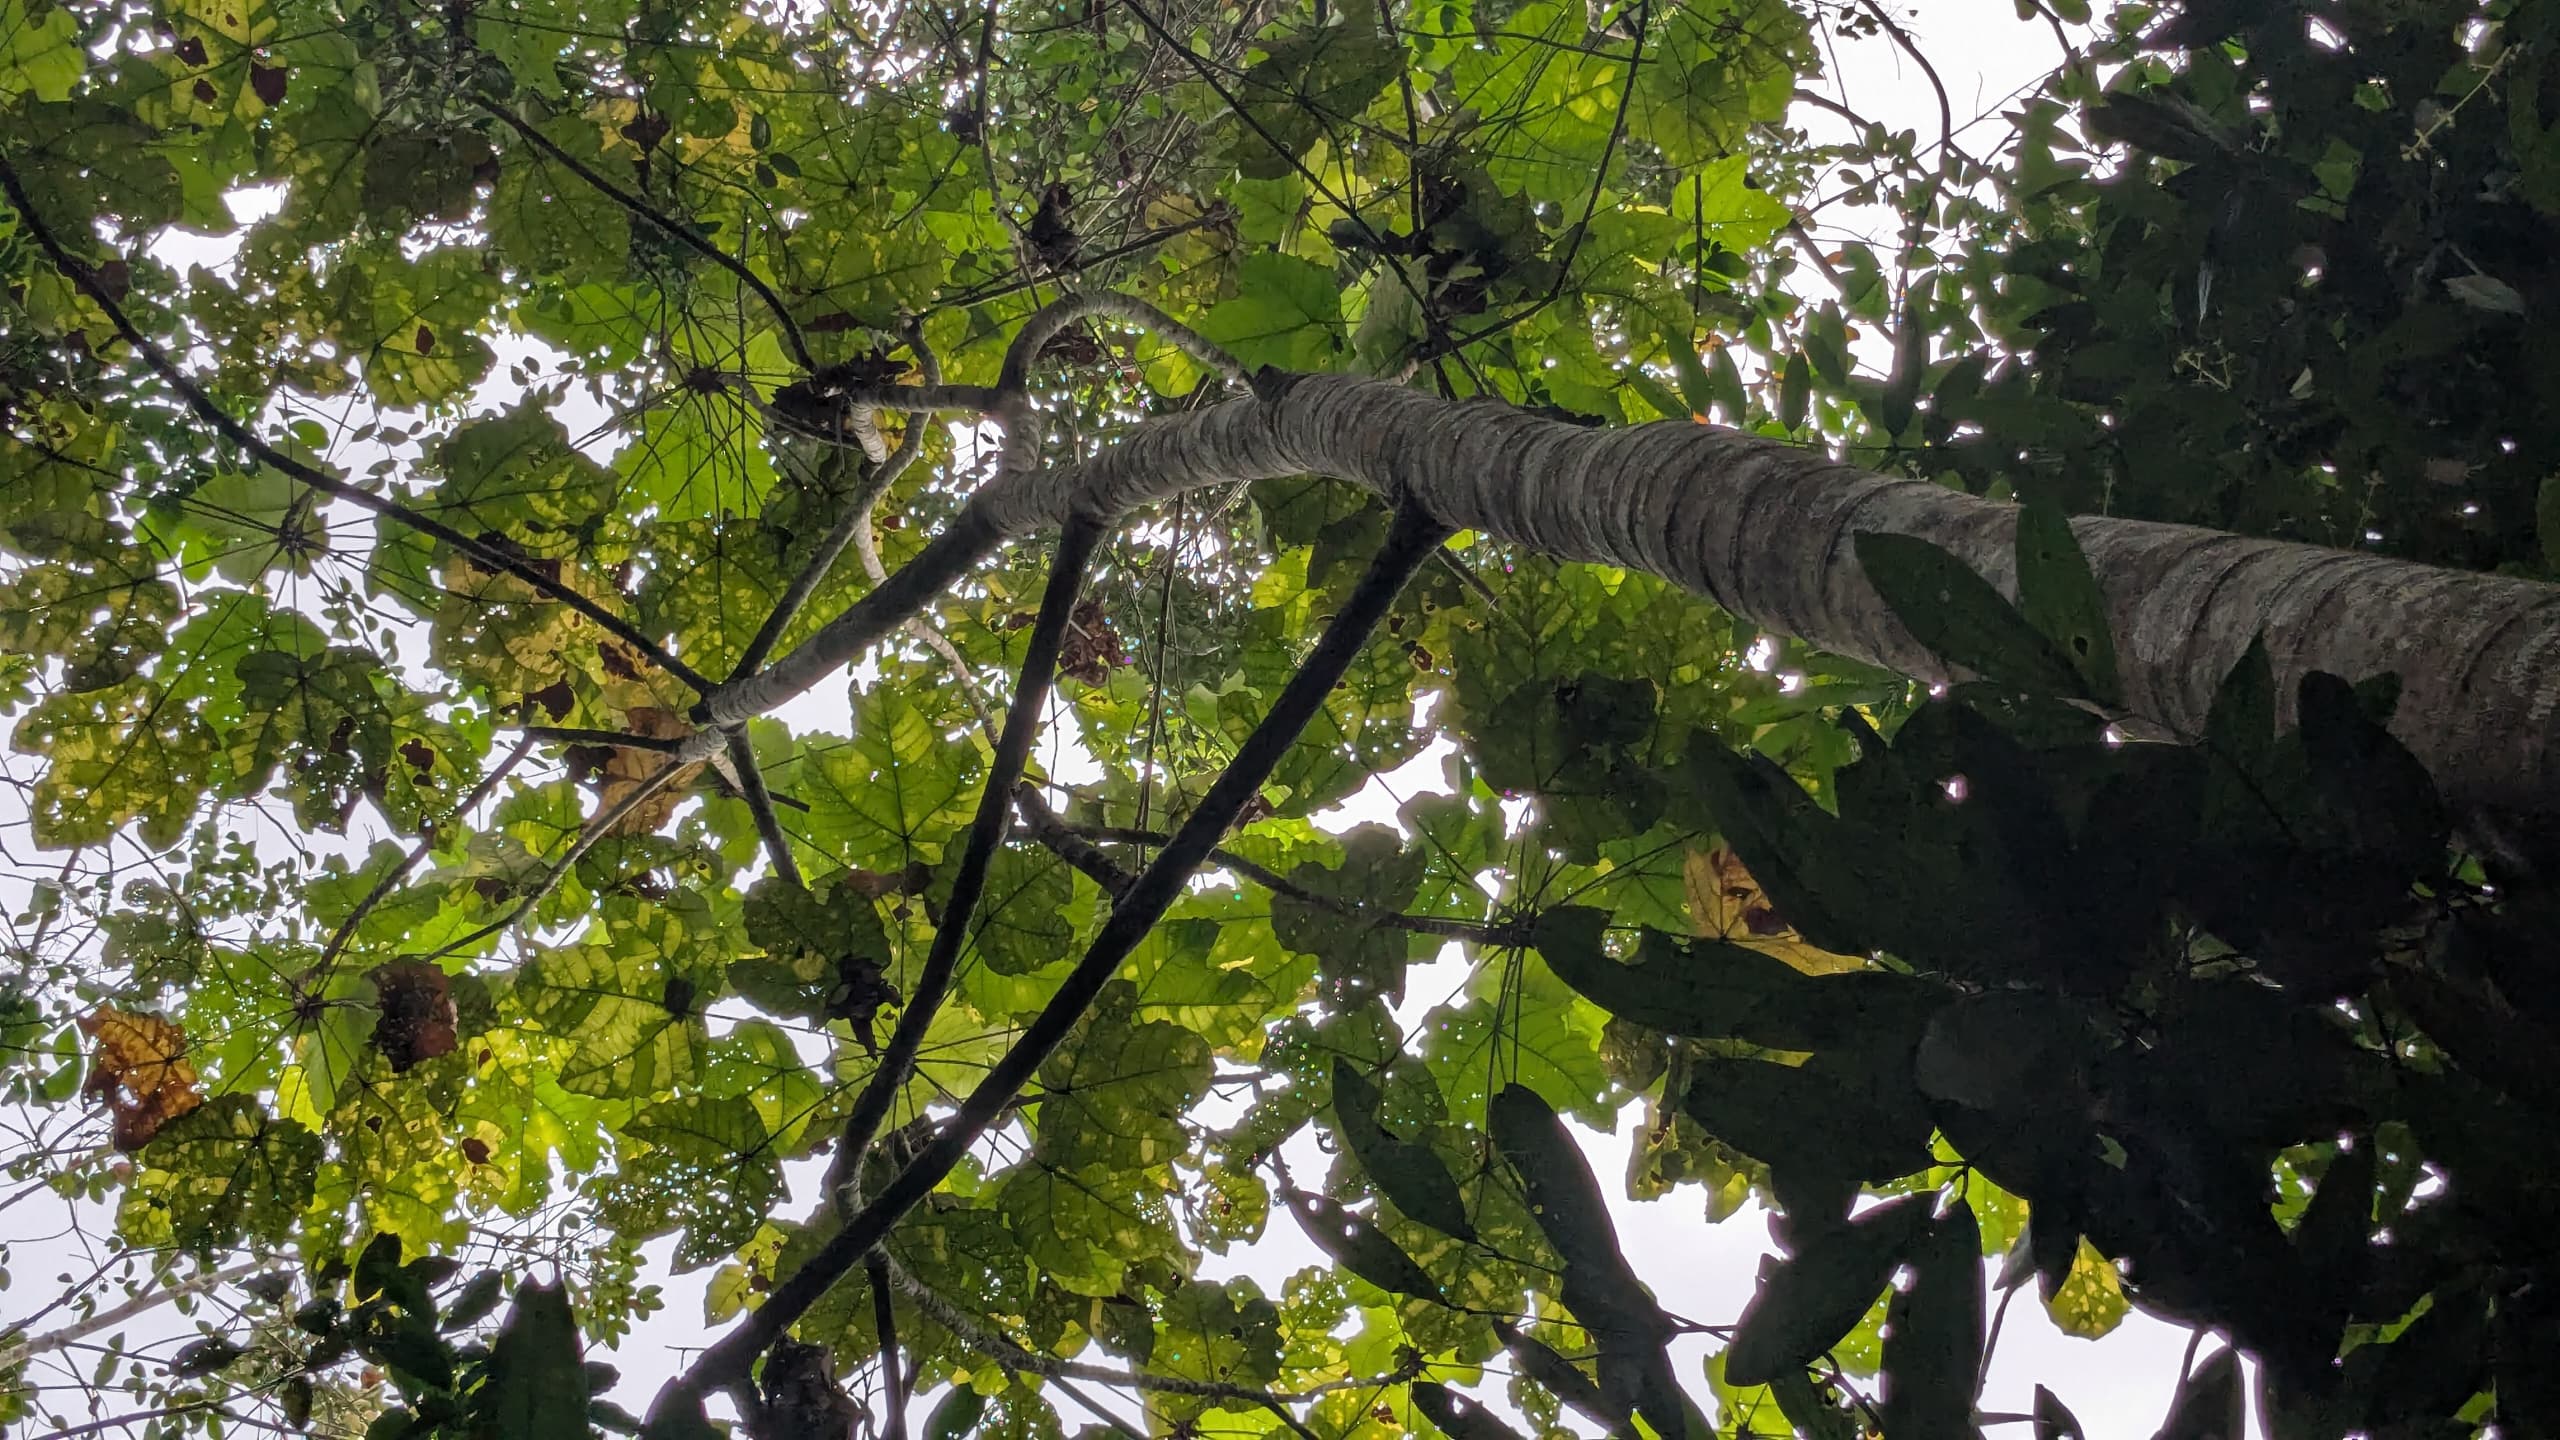
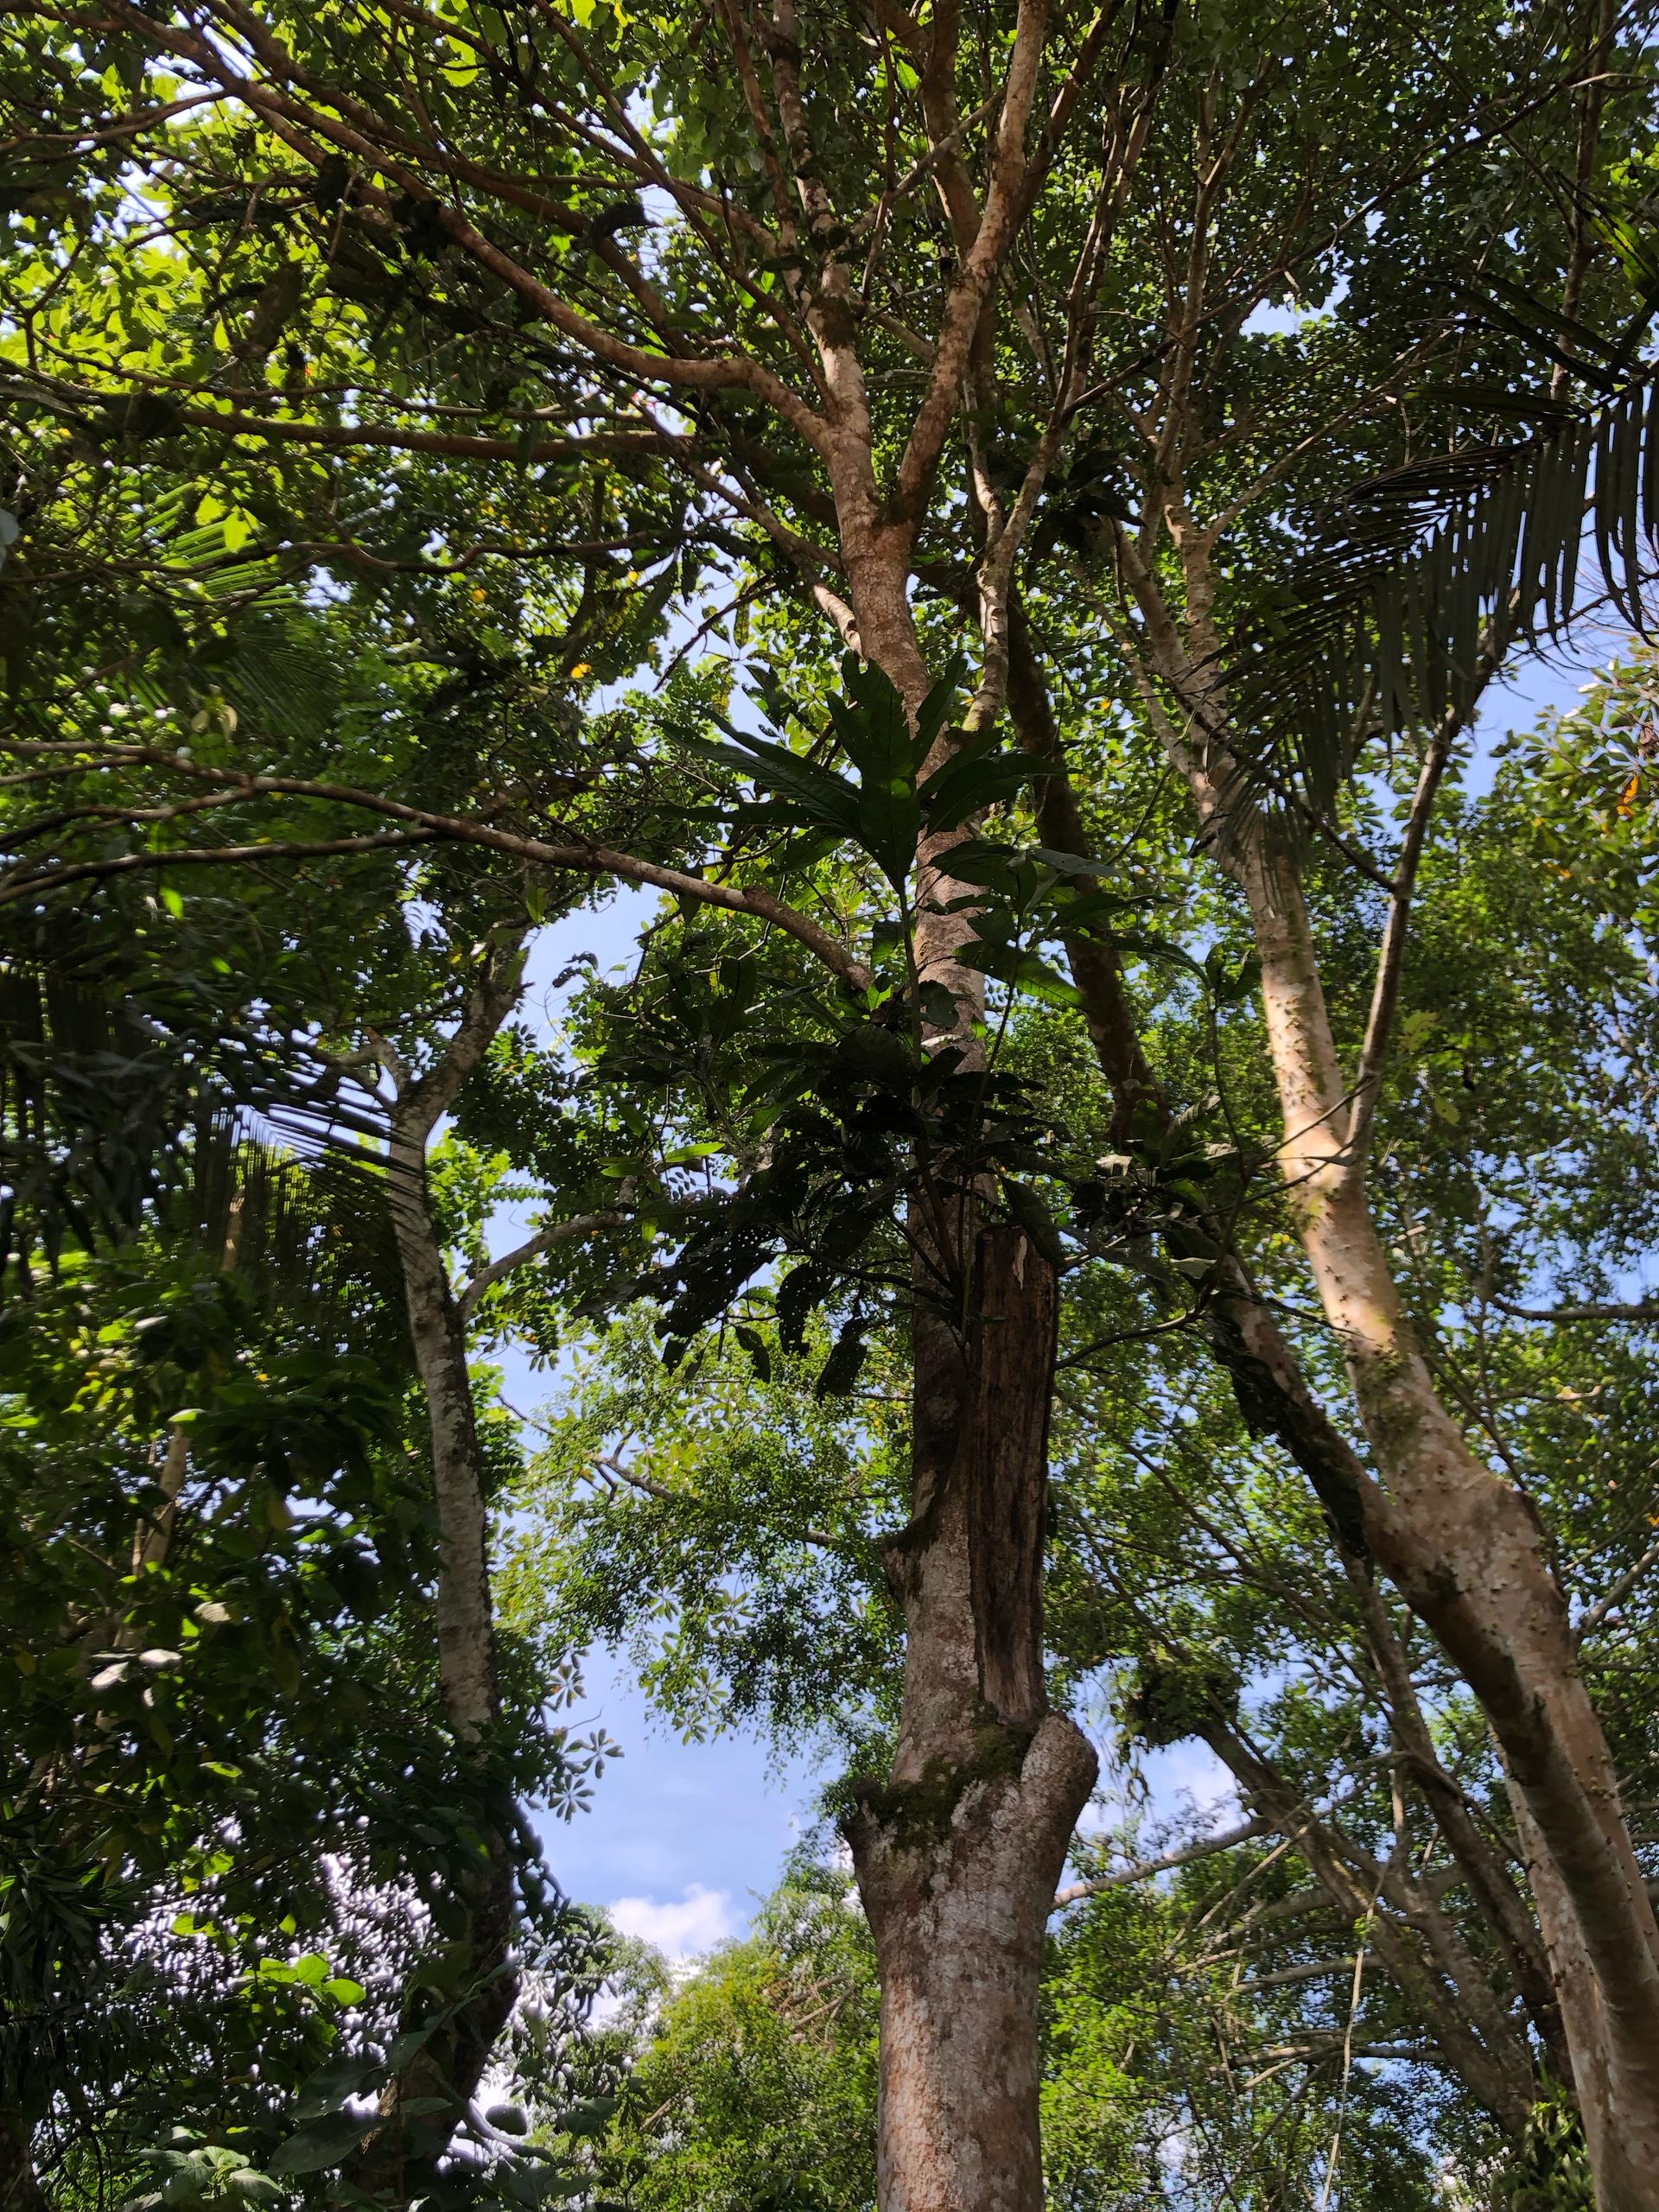
Flora
Exploring the rich diversity of tropical flora
- All
- Tropical Rainforest Trees
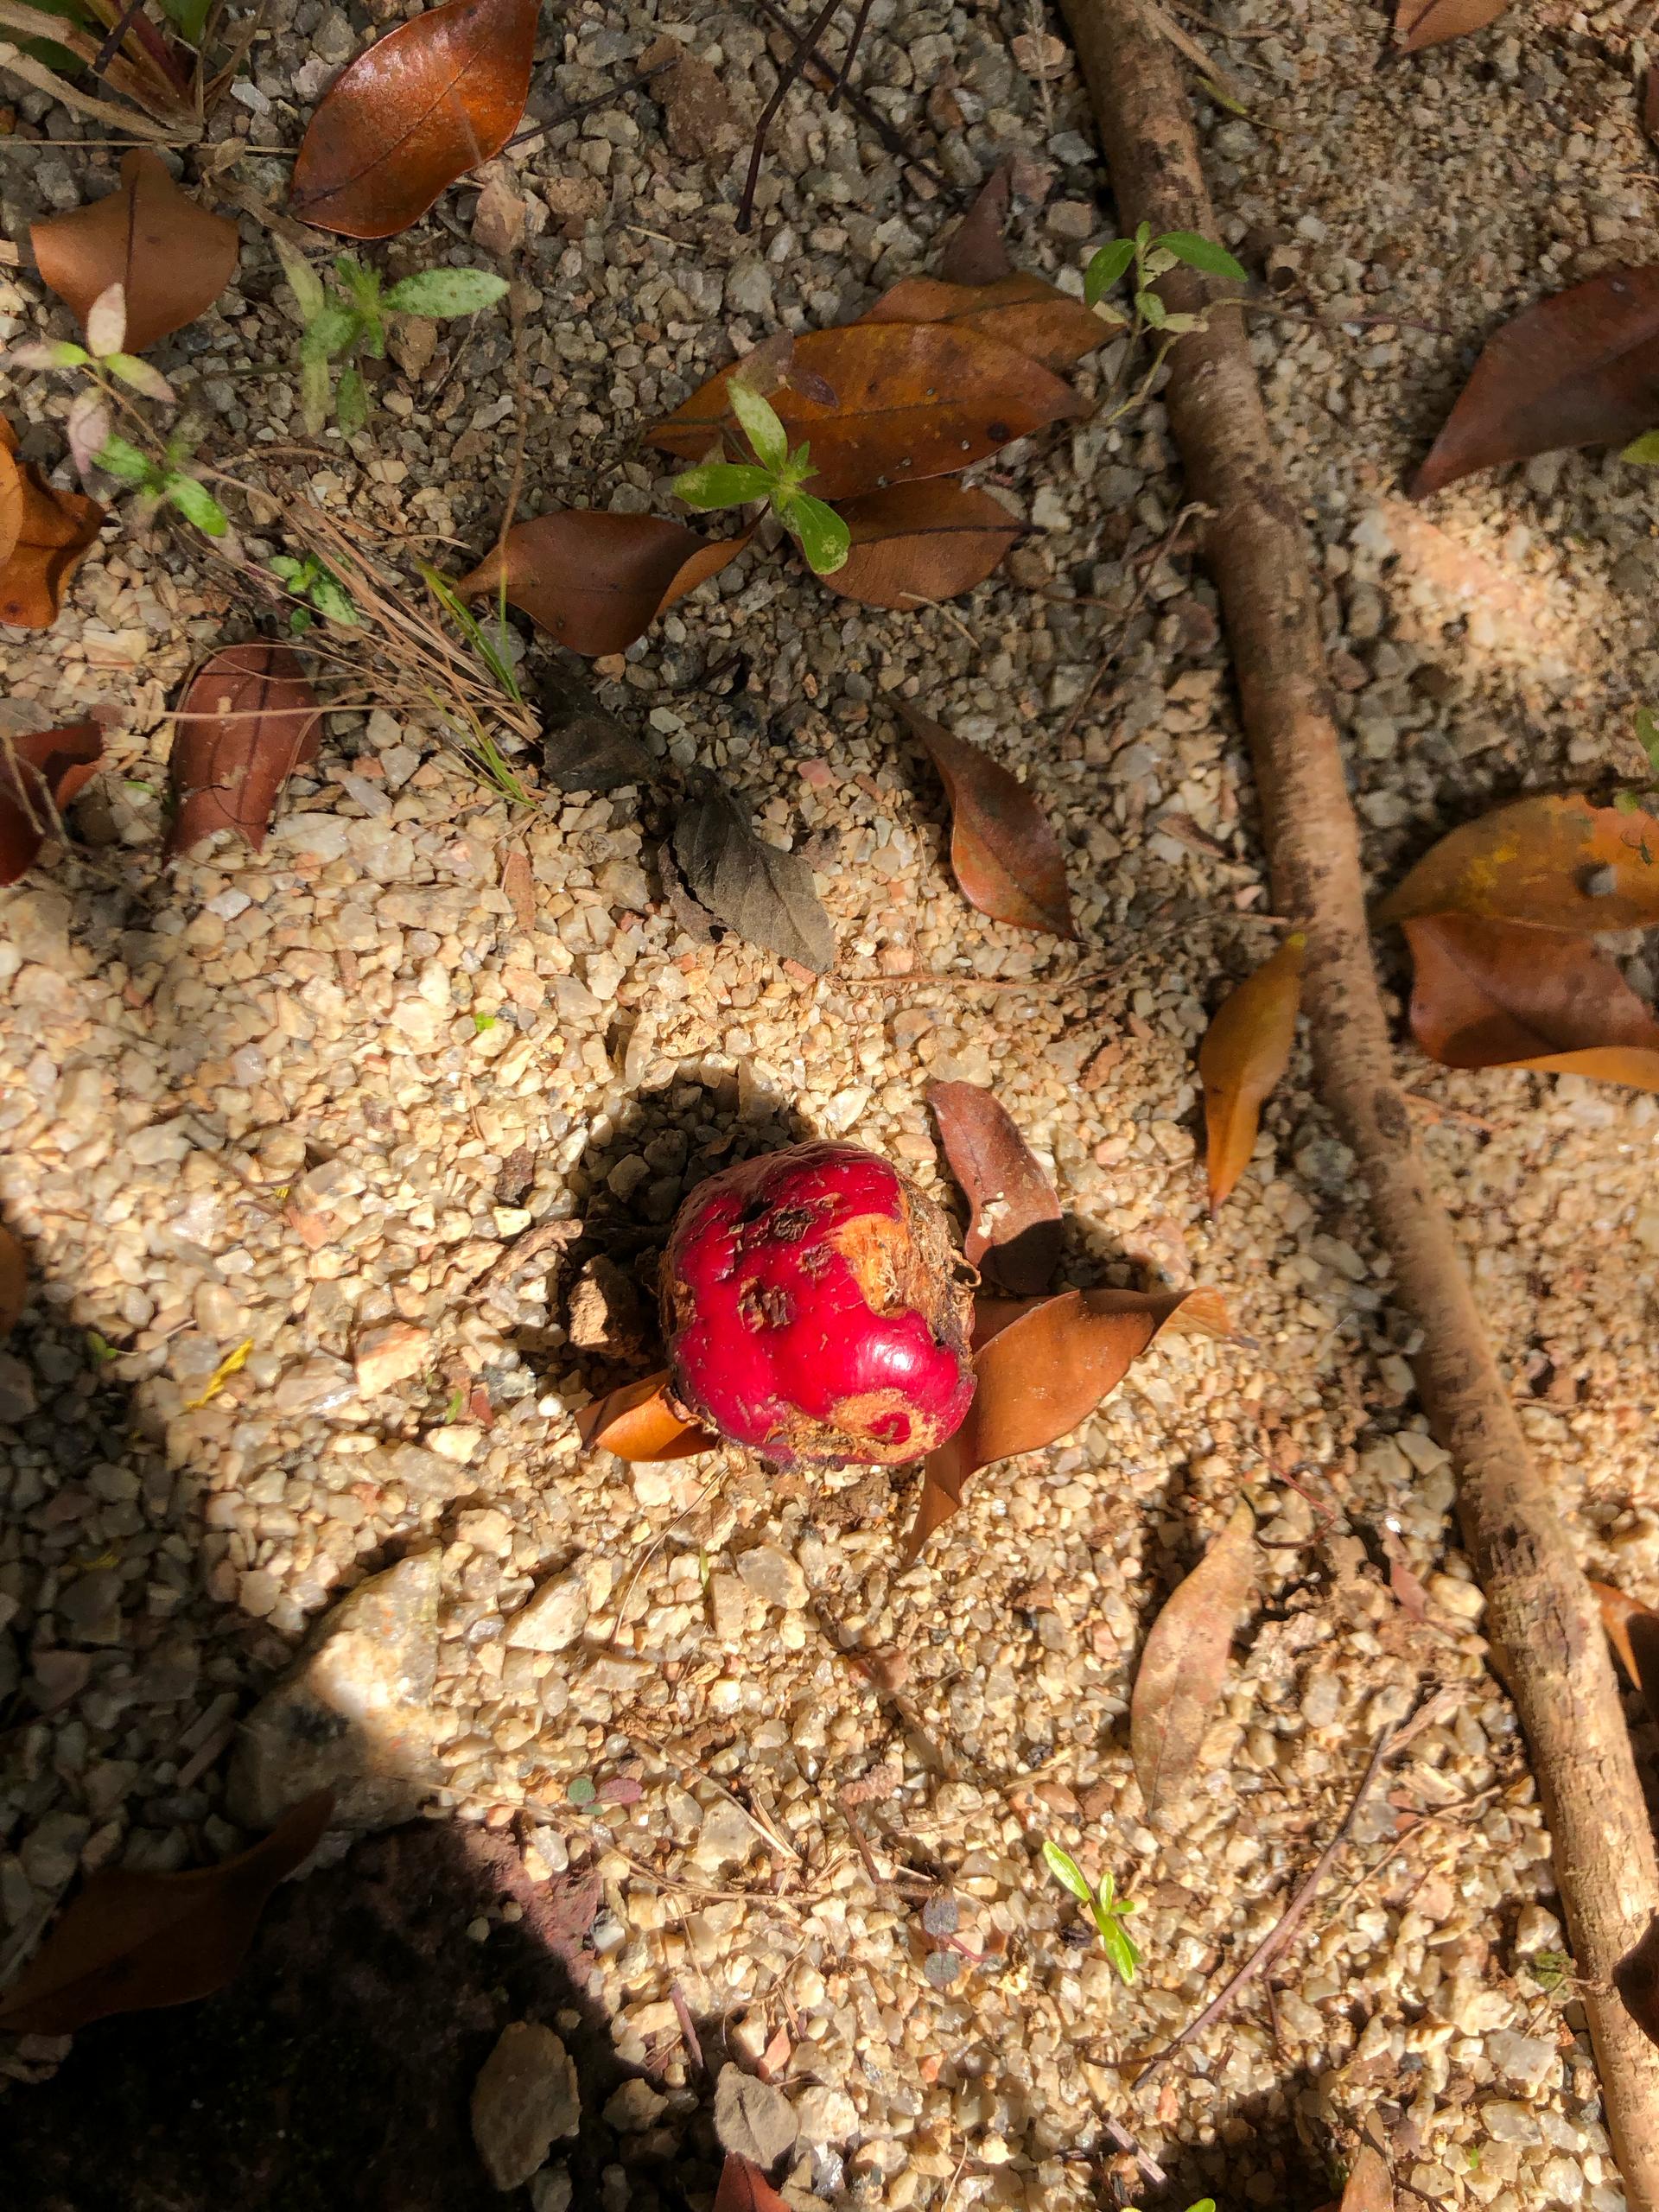
- Fruit-Bearing Trees
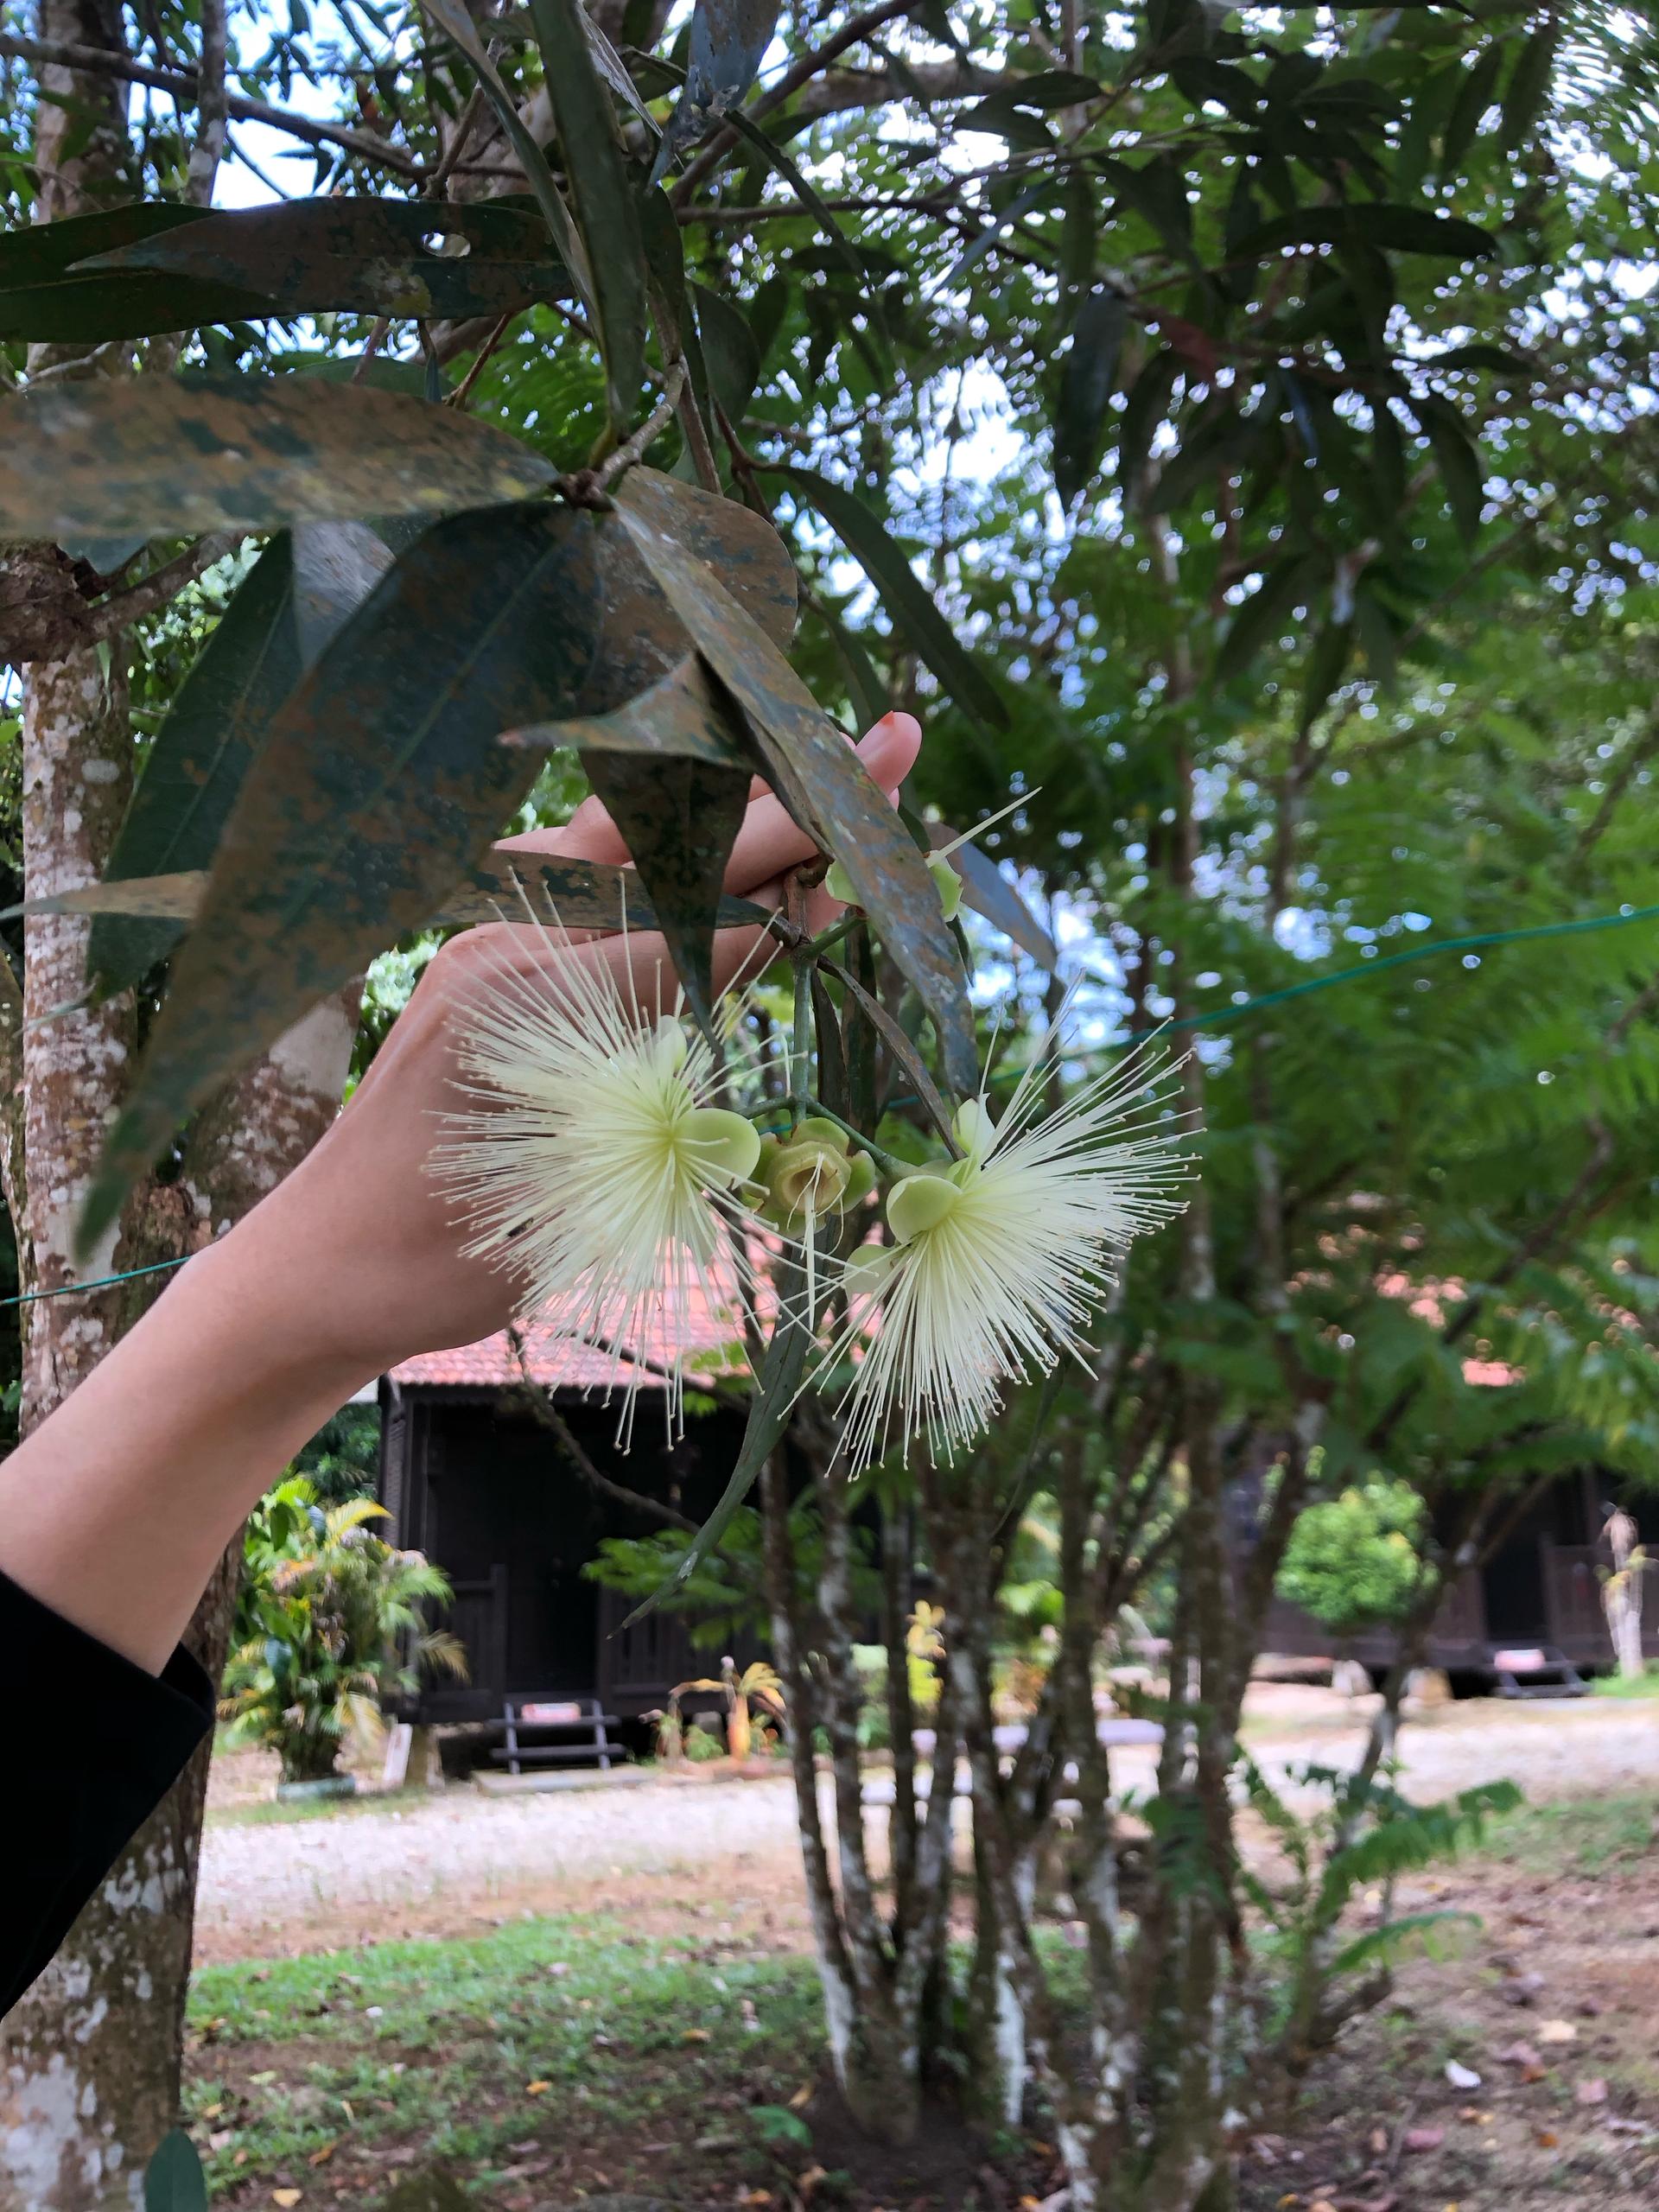
- Ornamental & Flowering Trees
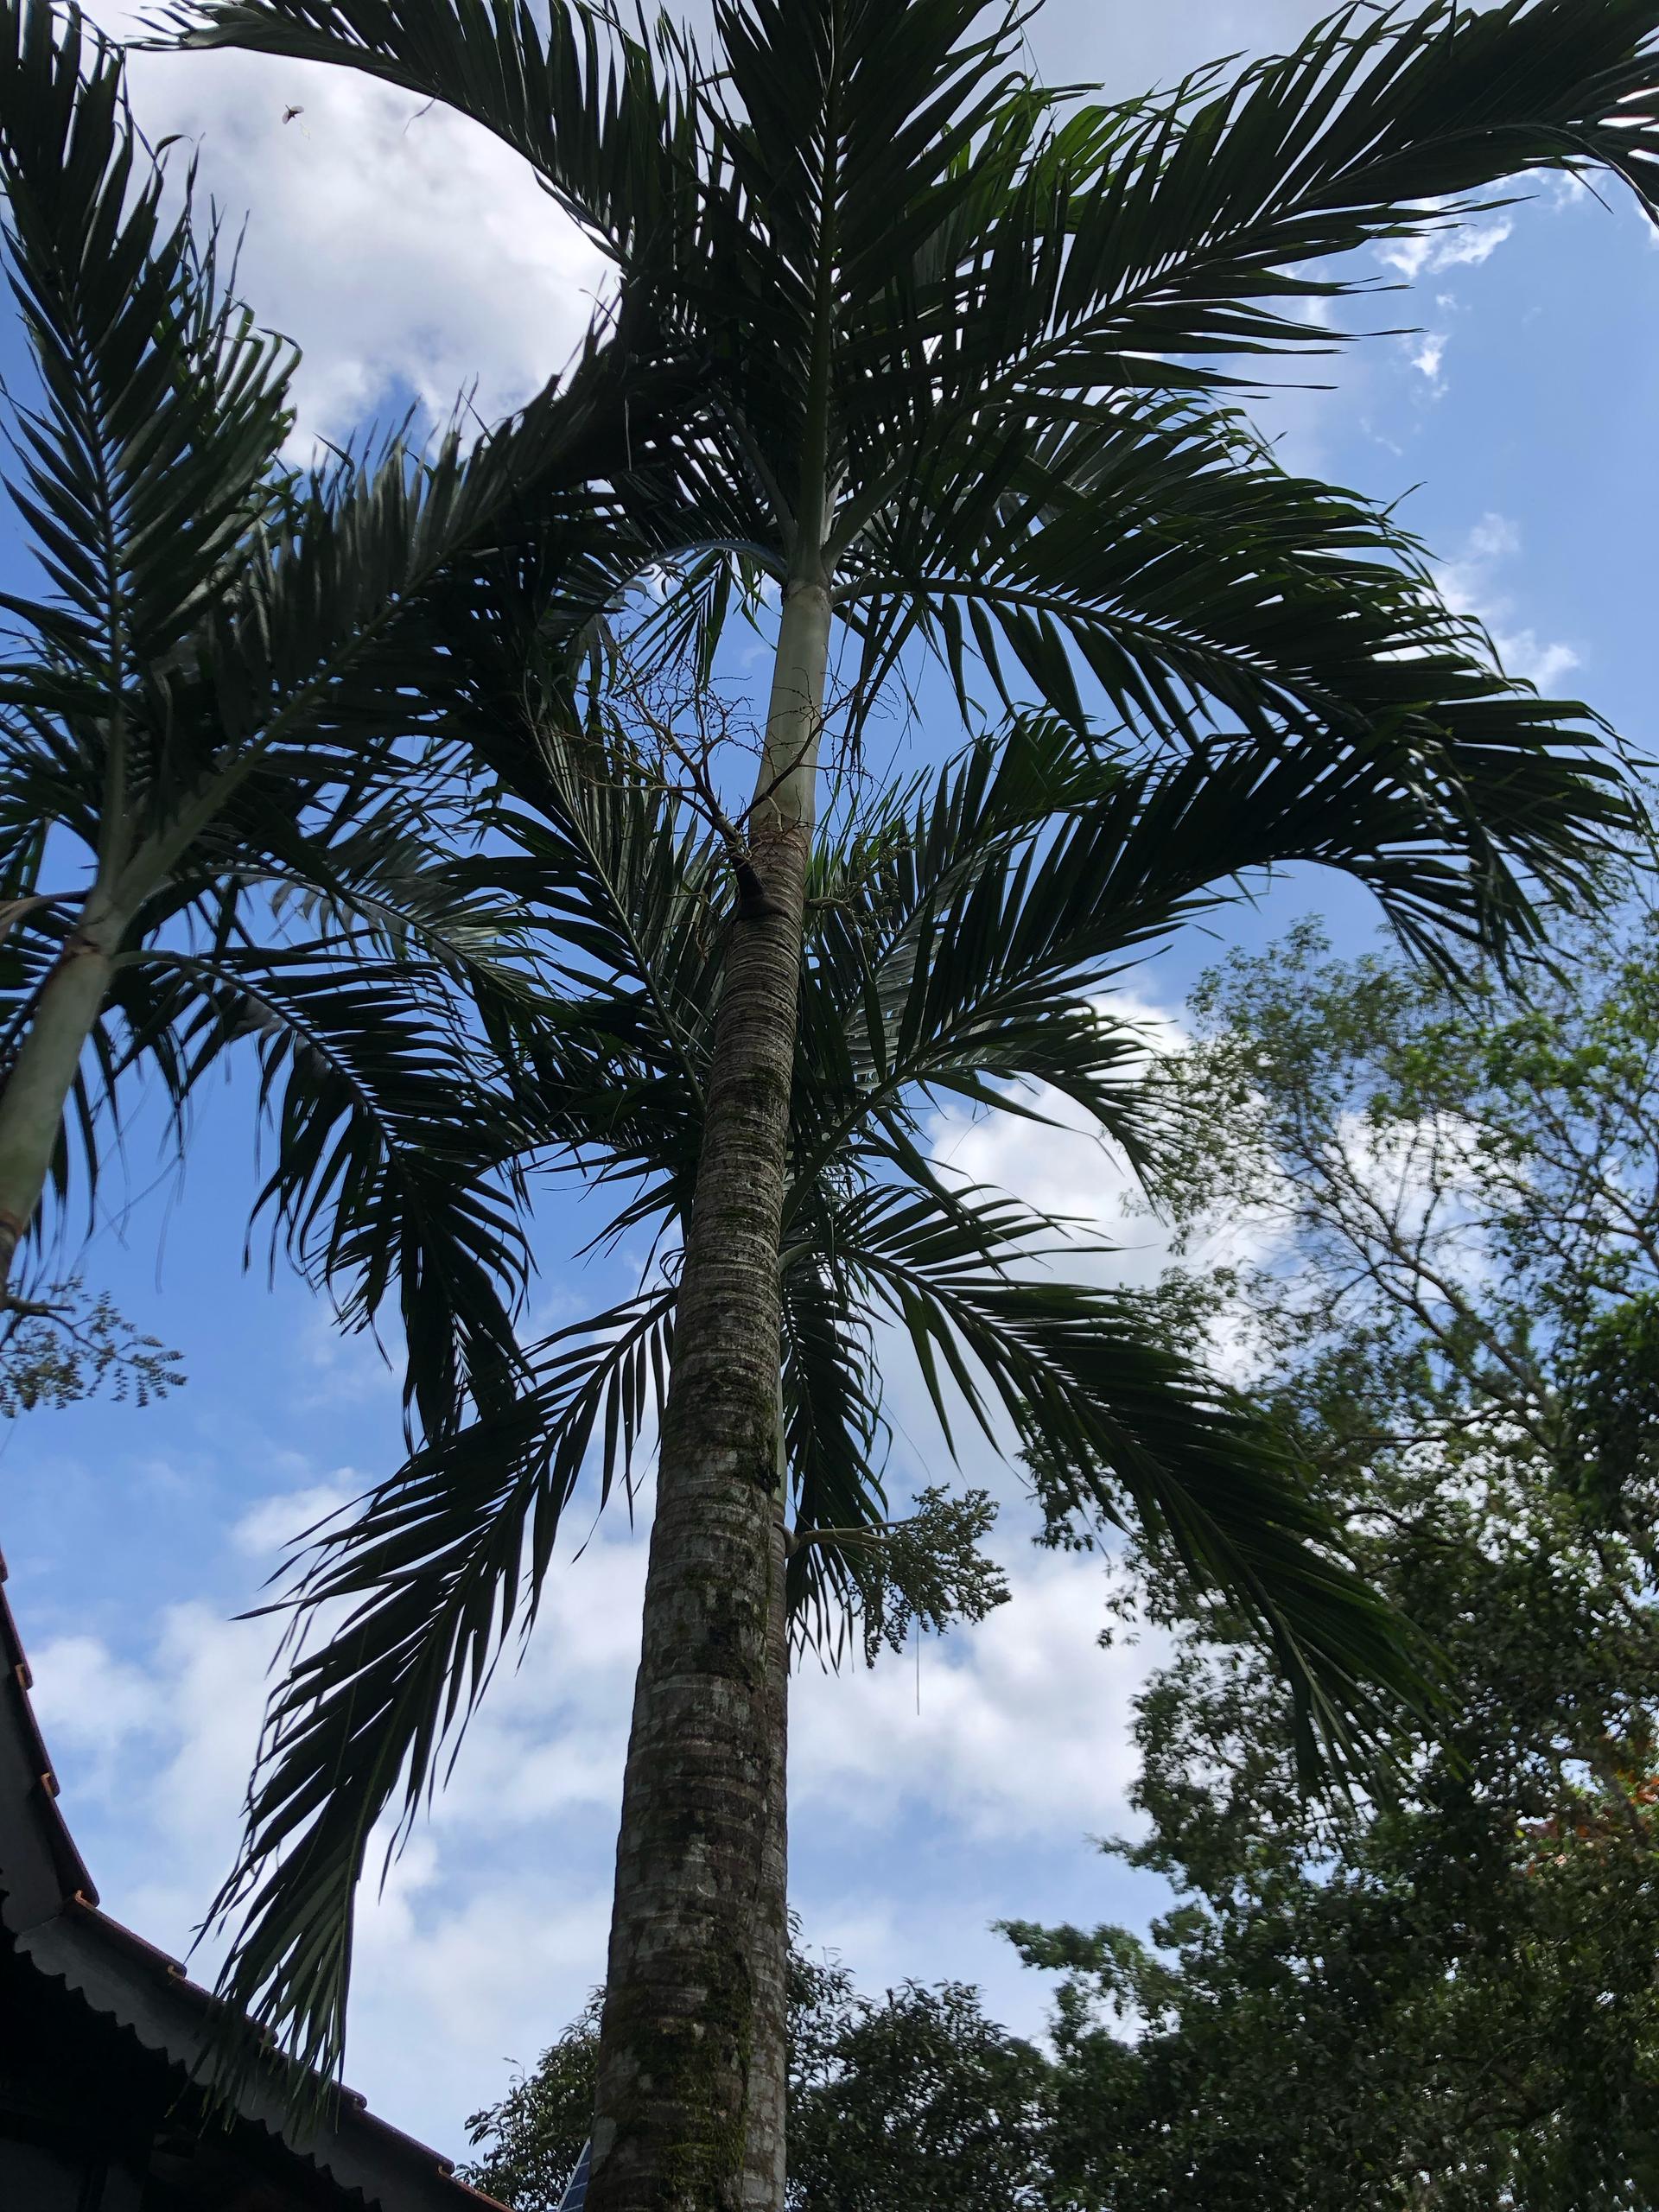
- Palm Trees

Check out the Final Output
Tree Distribution Map, Tree Height Density Map in Plot 1, 2, 3 , Tree DBH Heat Map in Plot 1, 2, 3.
Point Pattern Analysis (Quadrat Analysis) in Plot 1, 2
Data Processing
Final output of this project.
- All
- Tree Distribution Map
- Tree Height Density Map
- Point Pattern Analysis (Quadrat Analysis)
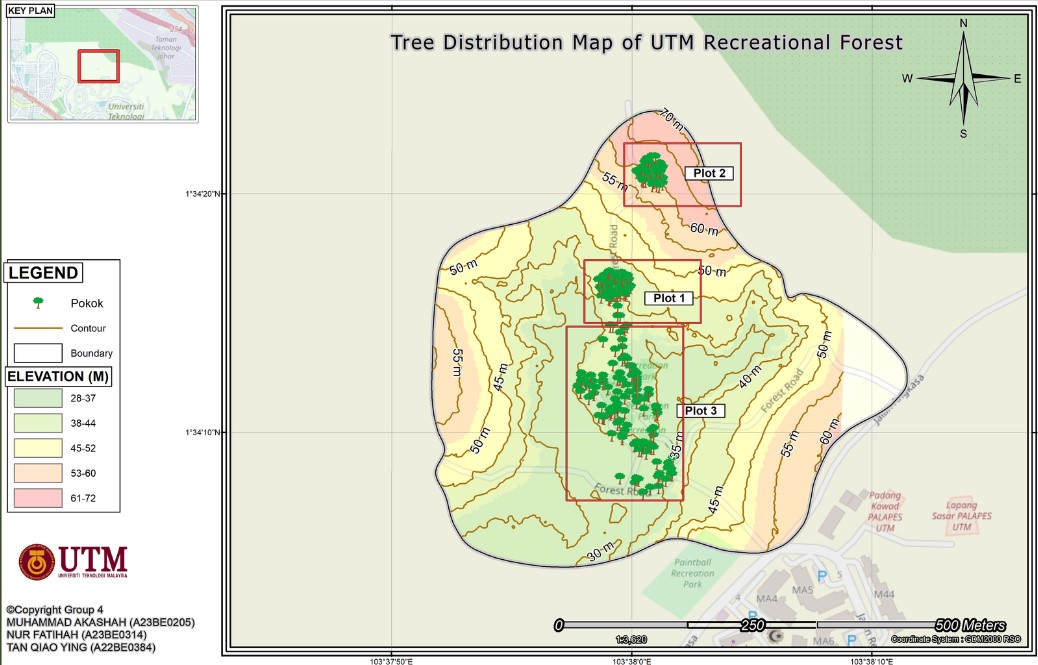
Tree Distribution Map
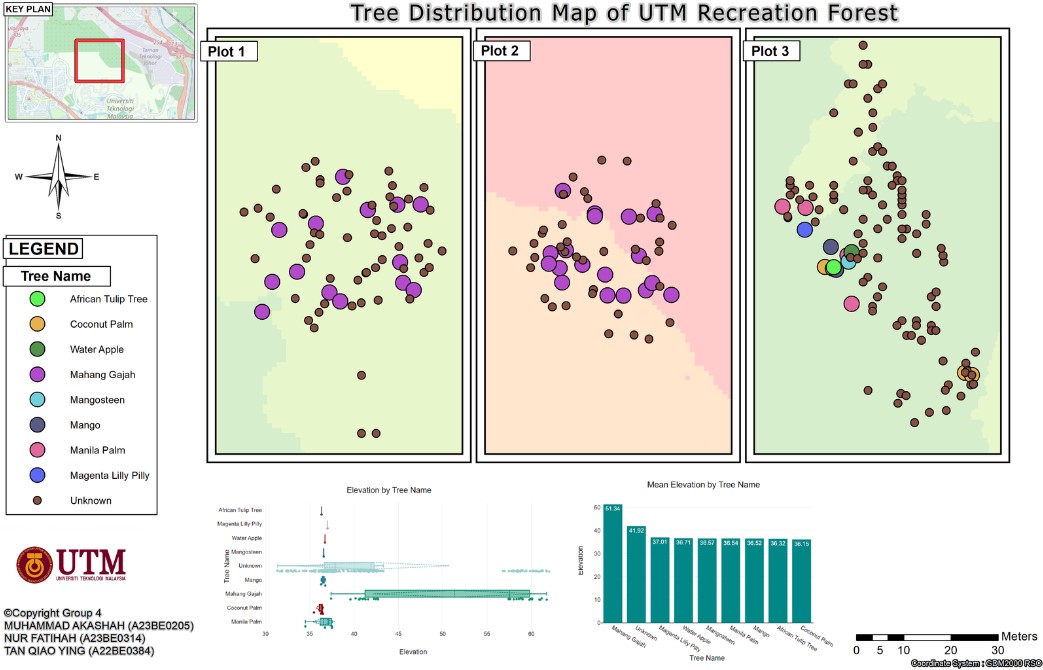
Tree Distribution Map part 2
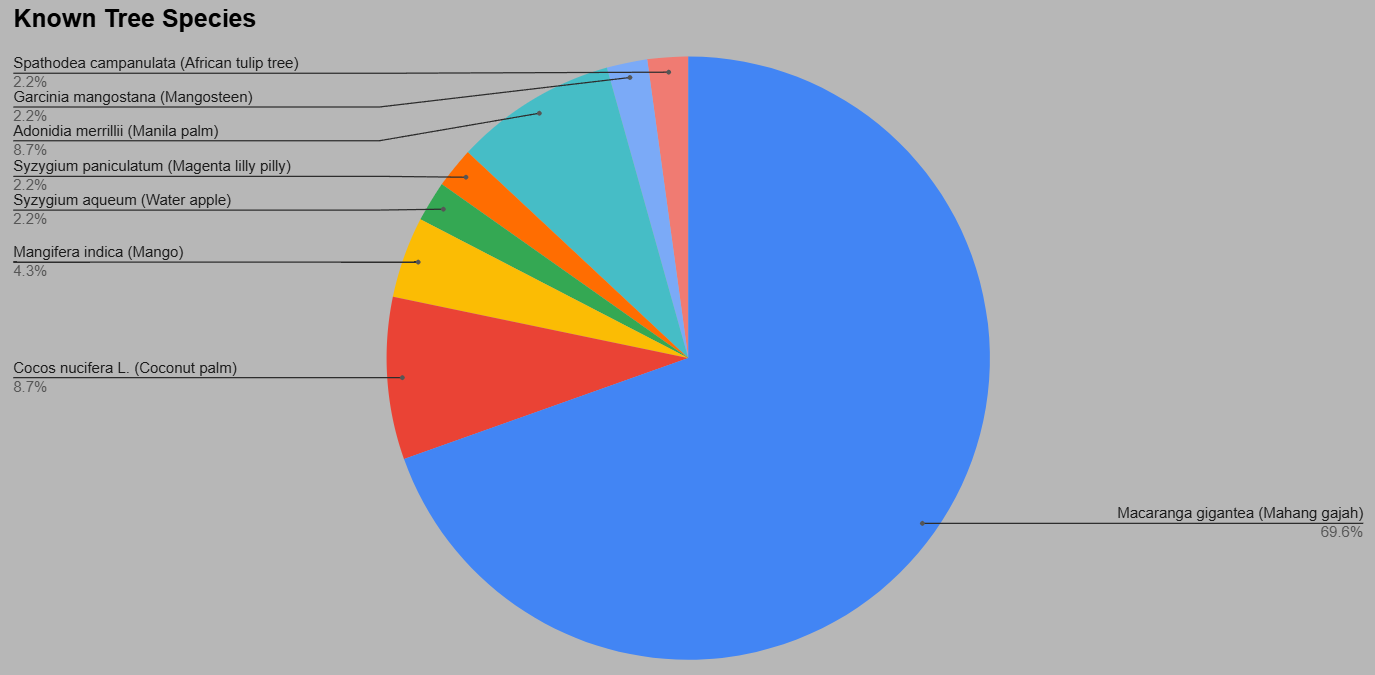
Pie Chart of Tree Distribution
The study identified a total of 8 tree species and 46 individual trees. Macaranga gigantea (Mahang gajah) was the dominant species, comprising 69.6% of the total tree population (32 trees).
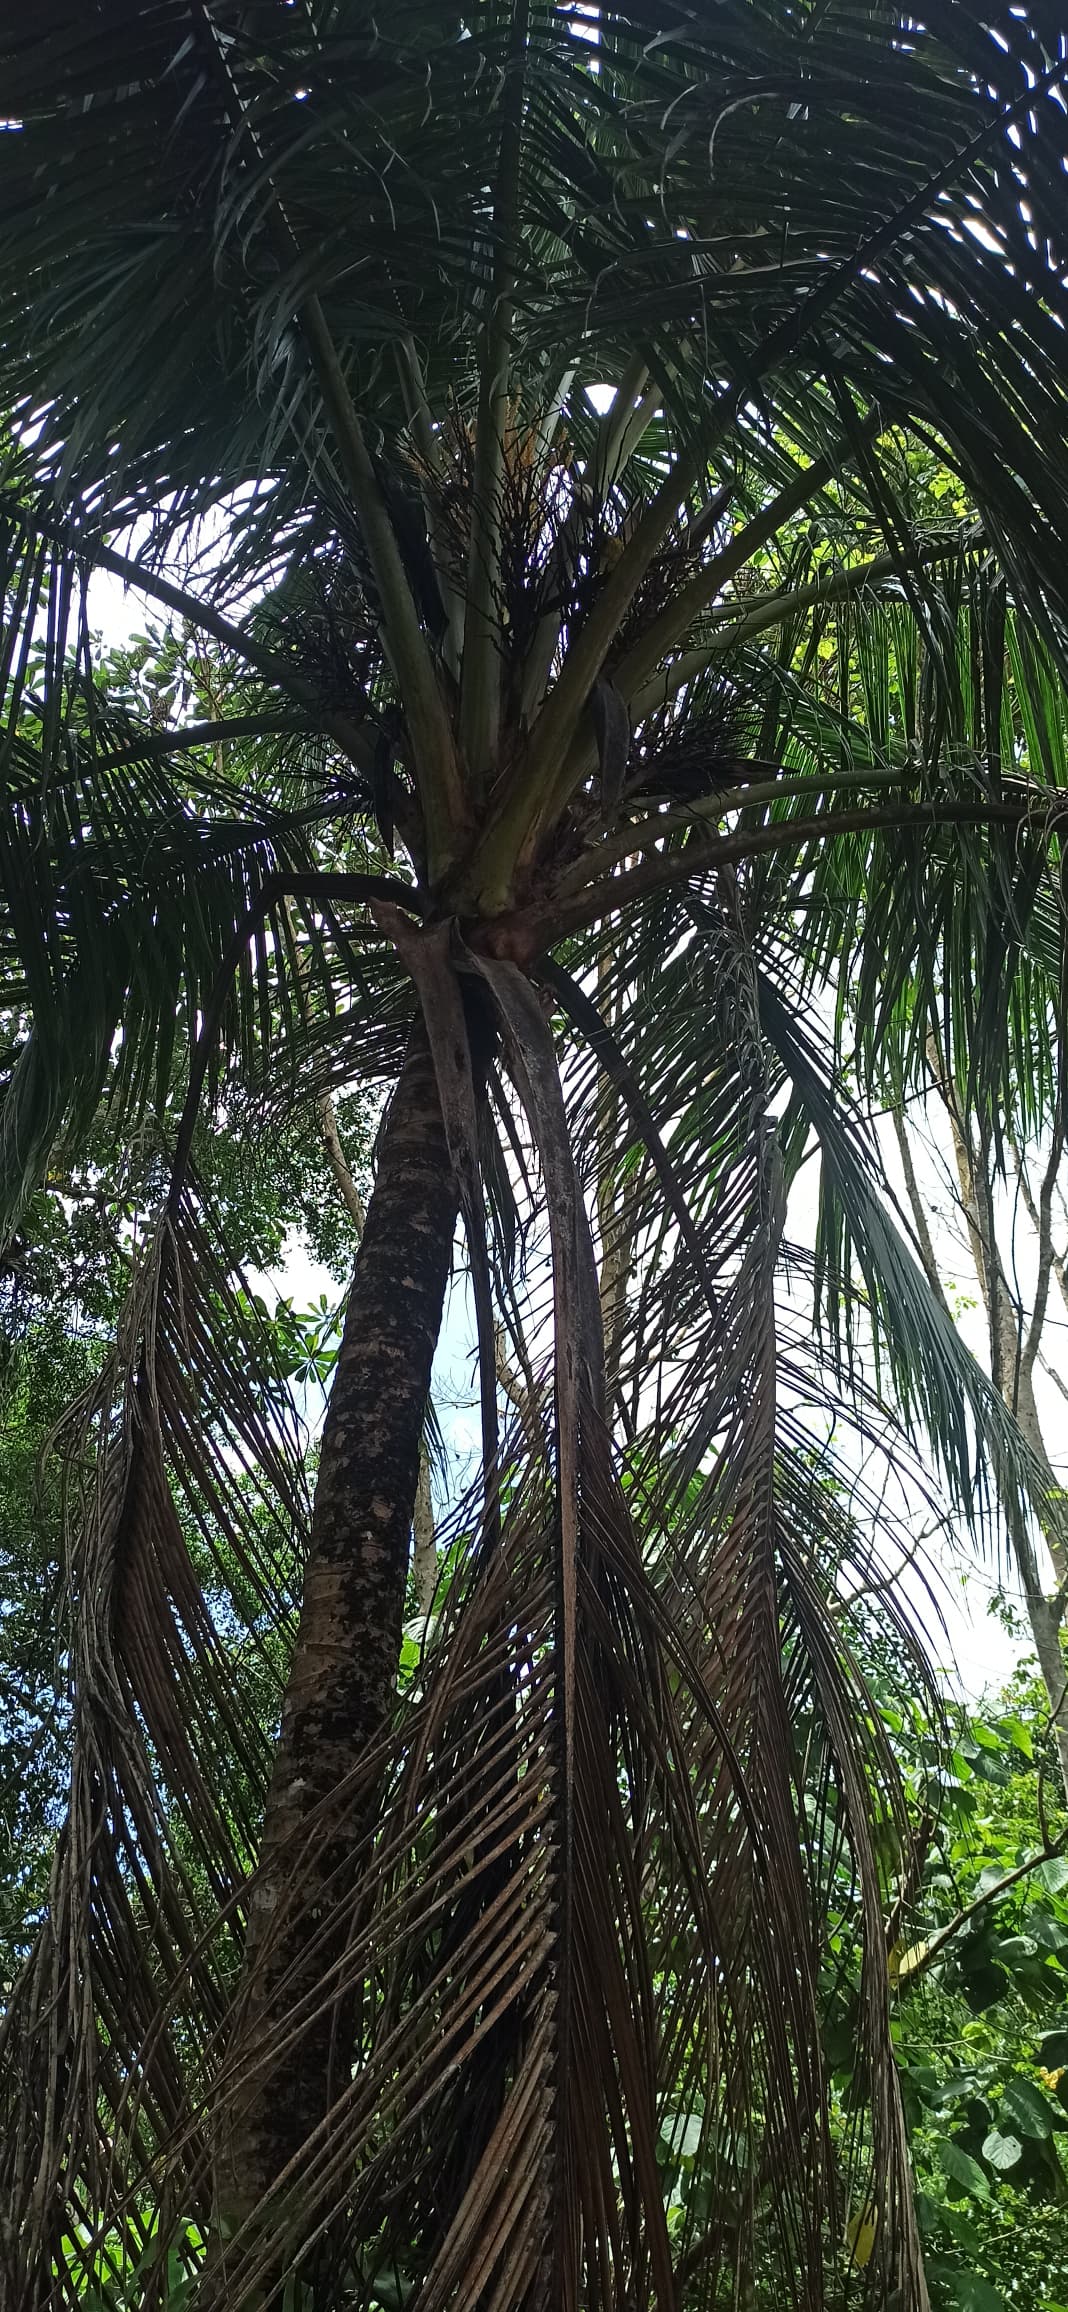
The second most abundant species, Adonidia merrillii (Manila palm) and Cocos nucifera L. (Coconut Palm), together accounted for 8.7% of the total (4 trees),
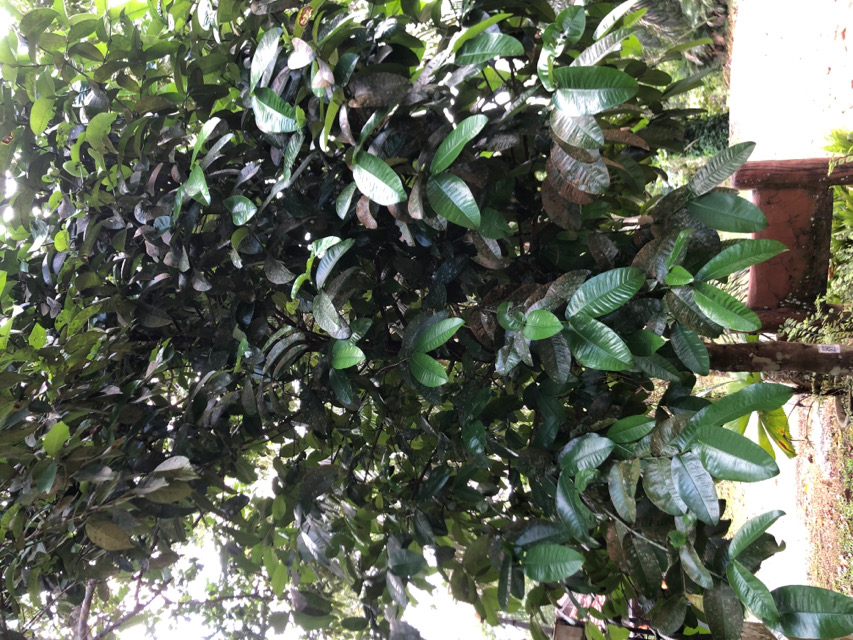
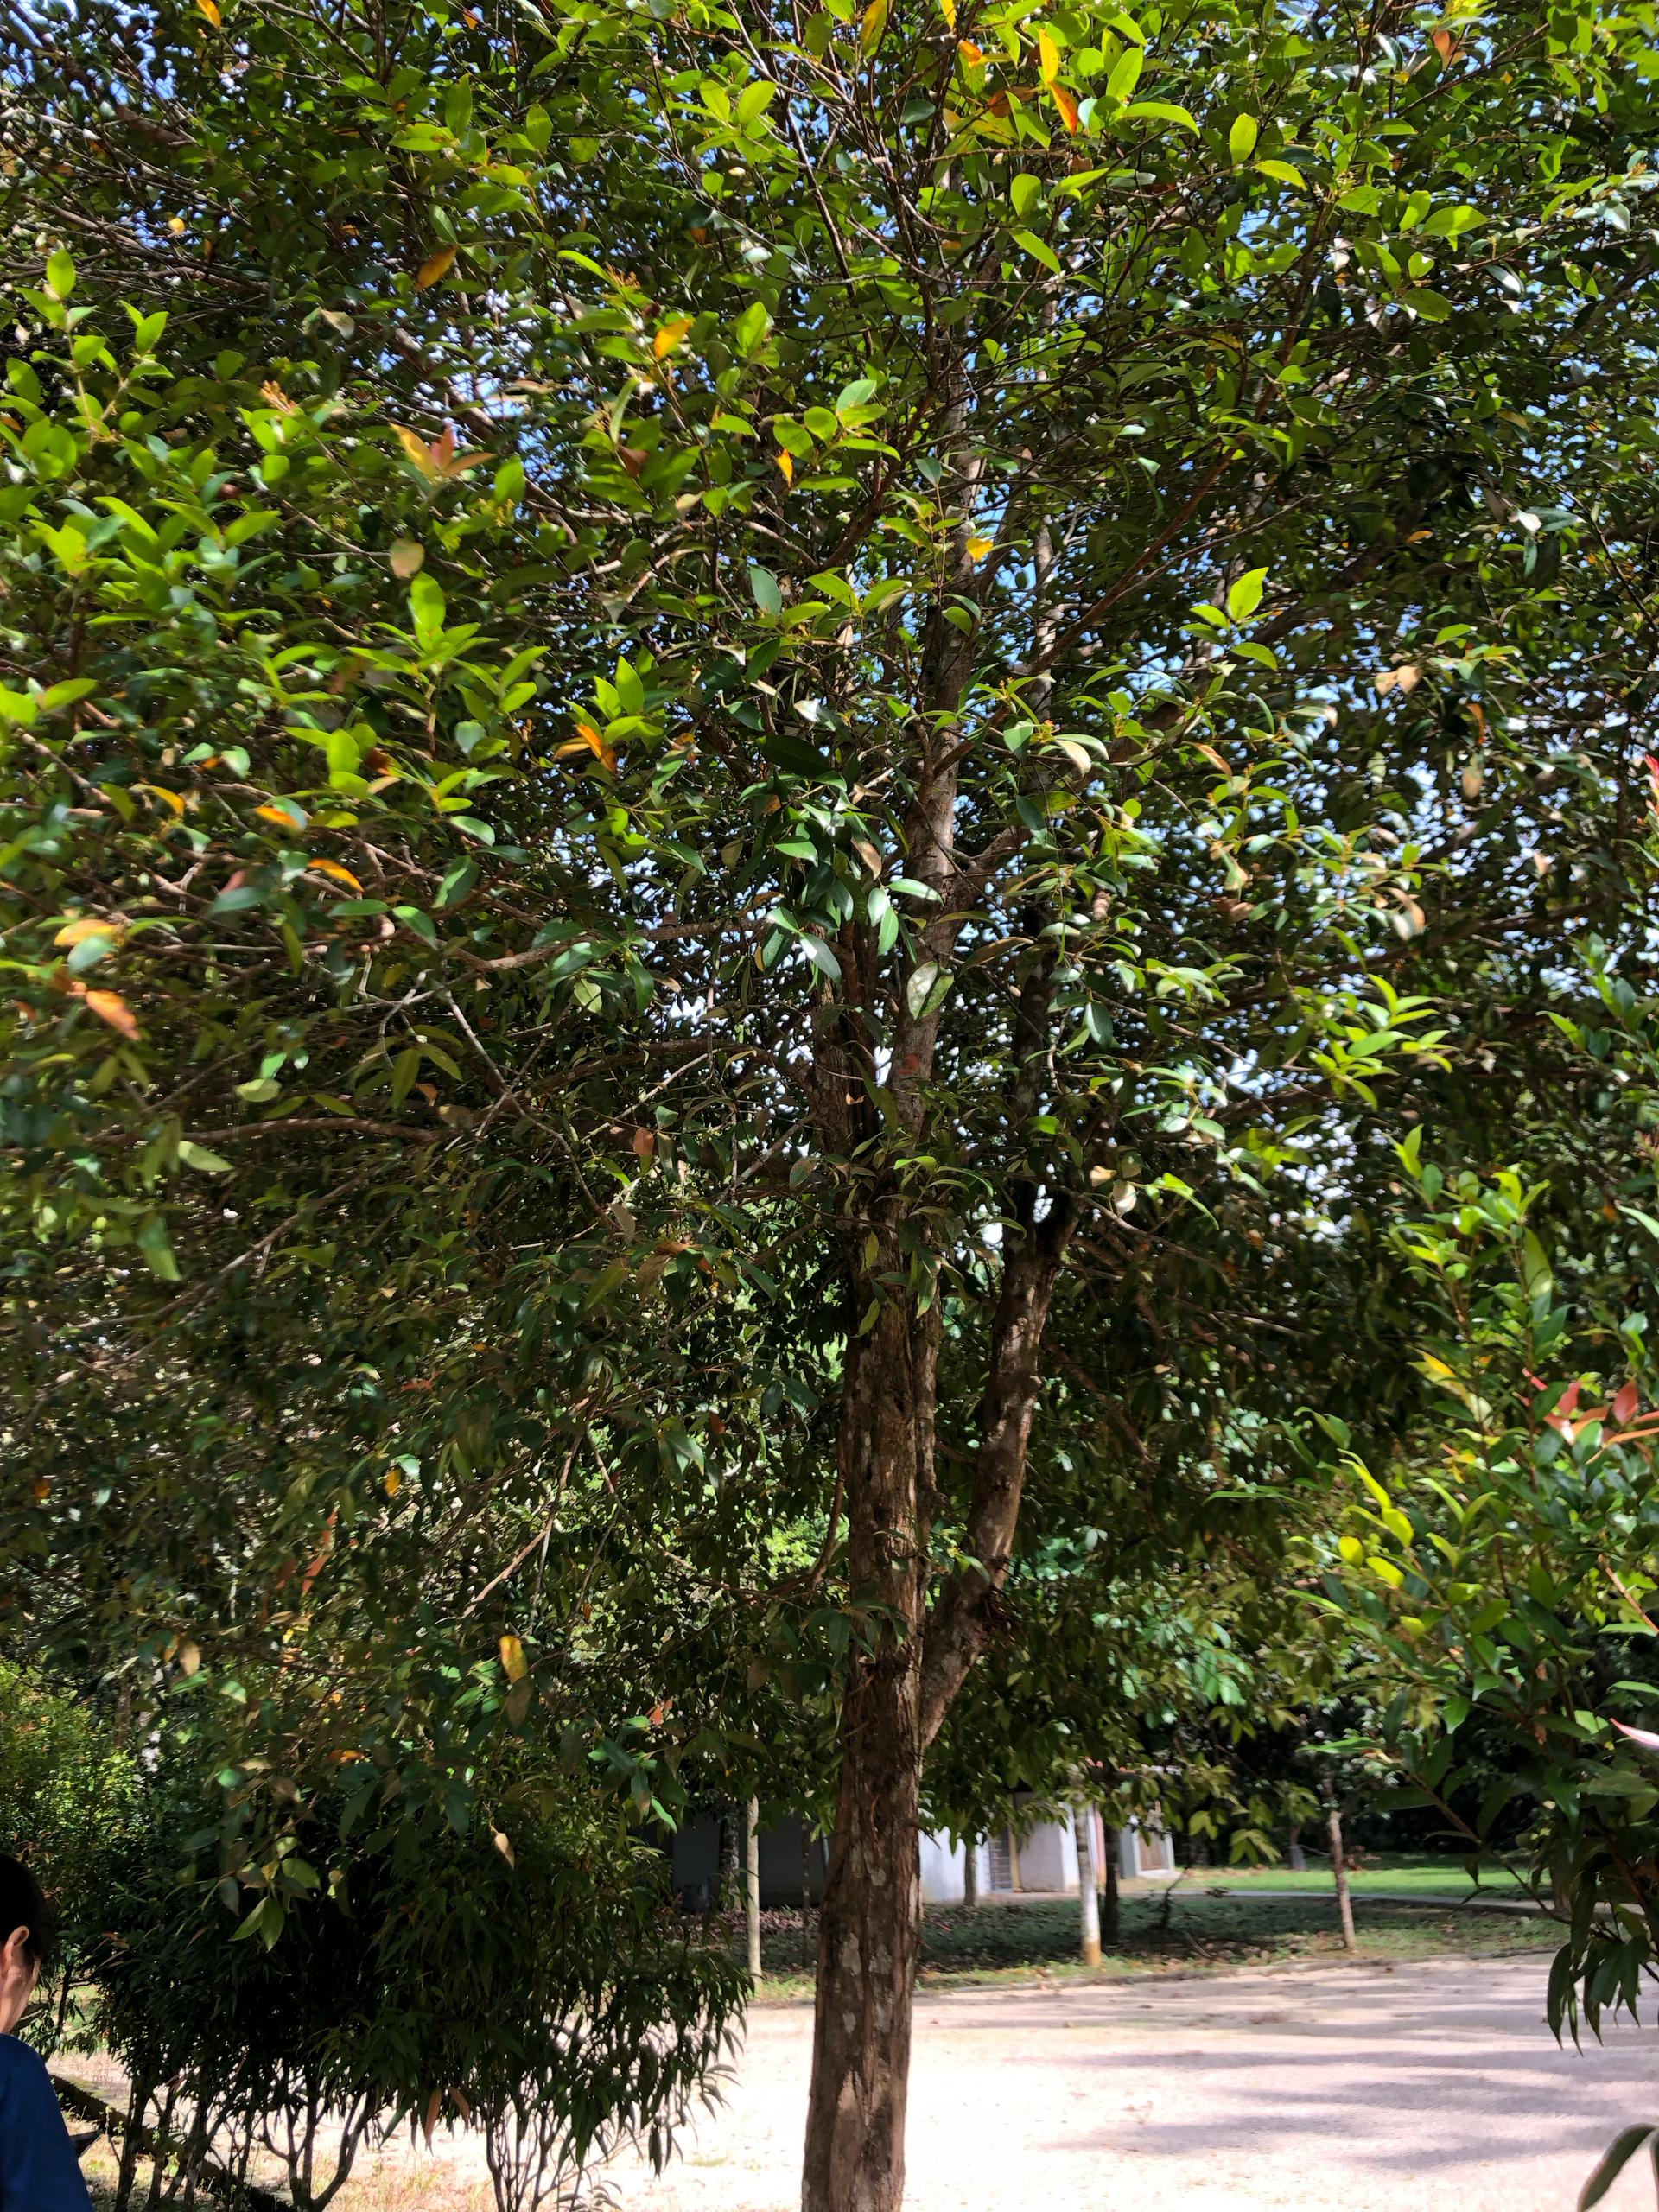
Other recorded species include Mangifera indica (Mango) (4.3%, 2 trees), while Syzygium paniculatum (Magenta lilly pilly), Syzygium aqueum (Water apple), Garcinia mangostana (Mangosteen), and Spathodea campanulata (African tulip tree) each contributed 2.3% (1 tree).
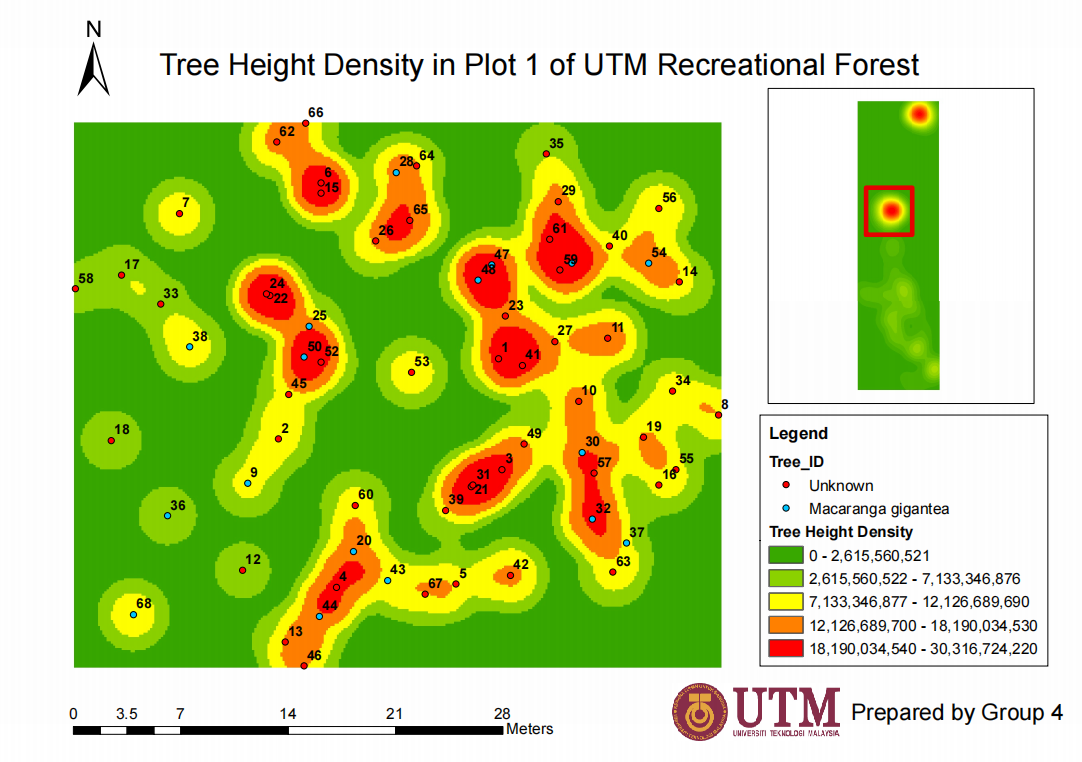
Tree Height Density Map in Plot 1
The high or low density of trees height are concentrated together. For example, in Plot 1, Tree ID with 3, 21, 31, 39 are concentrated together with high tree height density (red colour), while 17, 33, 38, 58 are concentrated together with low tree height density (yellow and light green colour), it may be caused by soil moisture or sunlight exposure which affect tree health and influence growth.
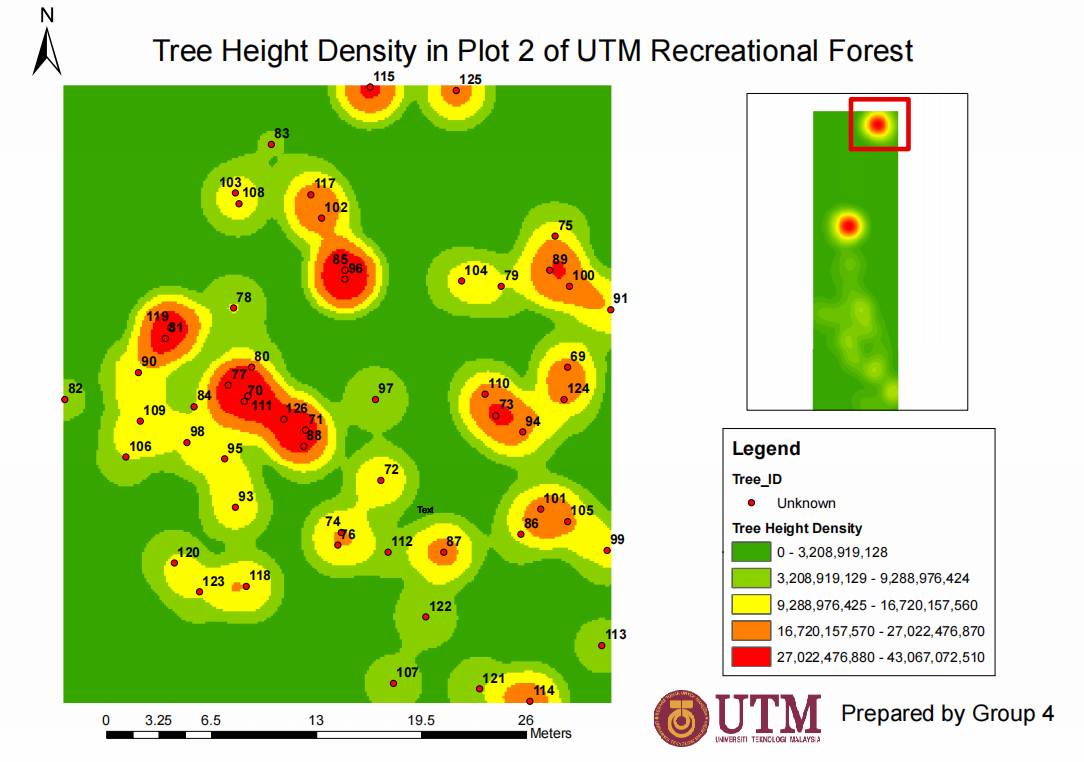
Tree Height Density Map in Plot 2
Same as Plot 1, for example in Plot 2, Tree ID with 70, 71, 77, 80, 88, 111, 126 are gather together with high tree height density (red color), while tree ID with 84, 90, 93, 95, 98, 106, 109 are gather together with low tree height density (yellow color).
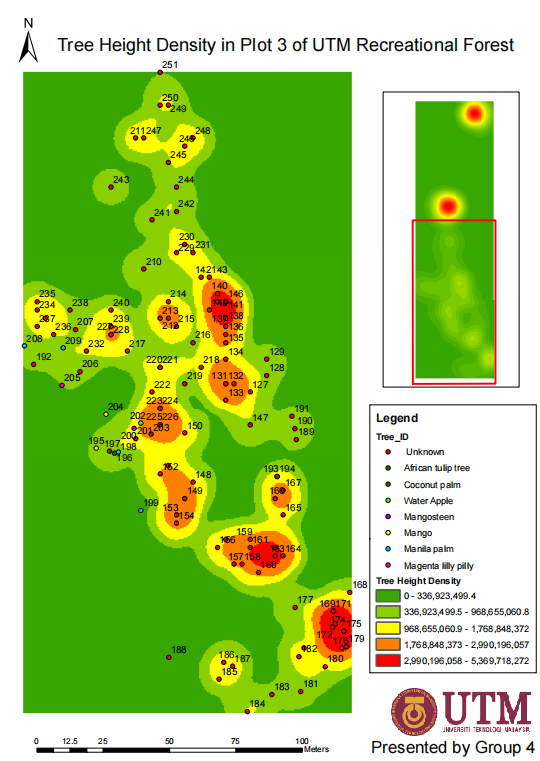
Tree Height Density Map in Plot 3
In Plot 3, all known tree species have lower height density than unknown tree species, known tree species are described inside the legend which are African tulip tree, Coconut palm, Water apple, Mangosteen, Mango, Manila palm, Magenta lilly pilly with Tree ID 195, 196, 197, 198, 199, 200, 202, 204, 205, 208, 209.
This may be because the unknown tree species are tropical rainforest trees, while the known tree species are other classification, such as palm trees, fruit-bearing trees, and flowering trees, which are located outside forest area (near residential houses of UTM Recreational Forest). The tropical rainforest tree always grows higher than other tree types.
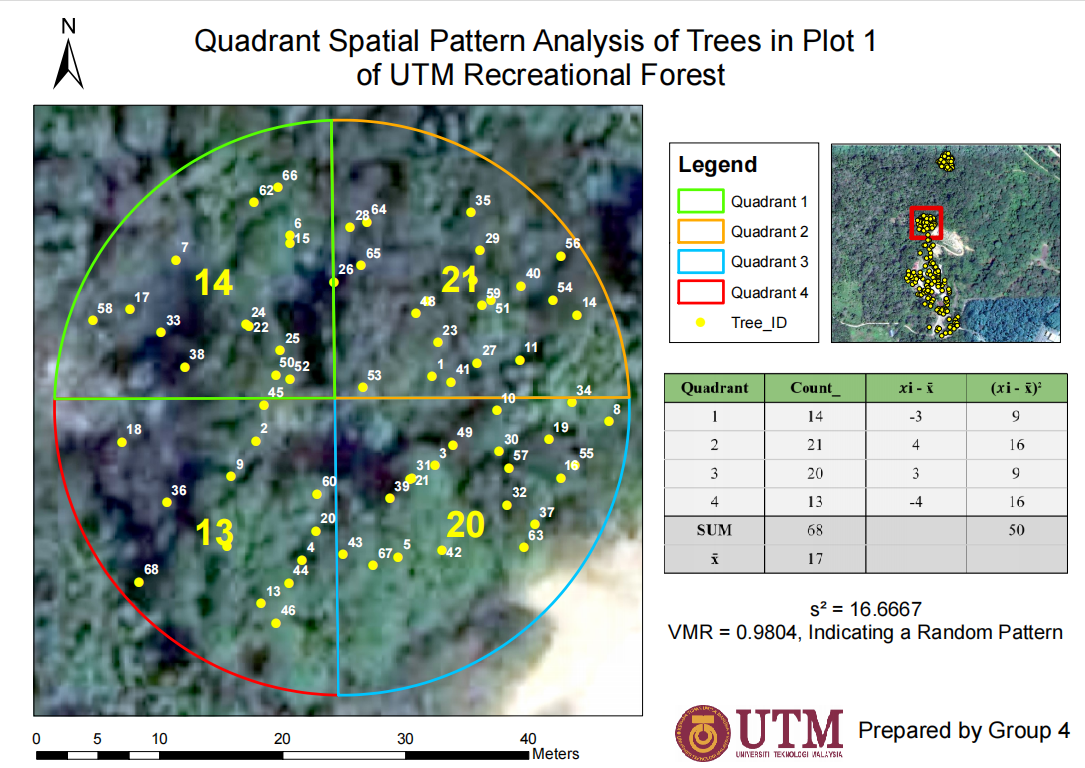
Quadrant Spatial Analysis of Trees in Plot 1
The result for Plot 1 is VMR = 0.9804 ≈ 1, which indicating a random pattern of tree distribution. This means condition of trees grow well and did not affect by environment.
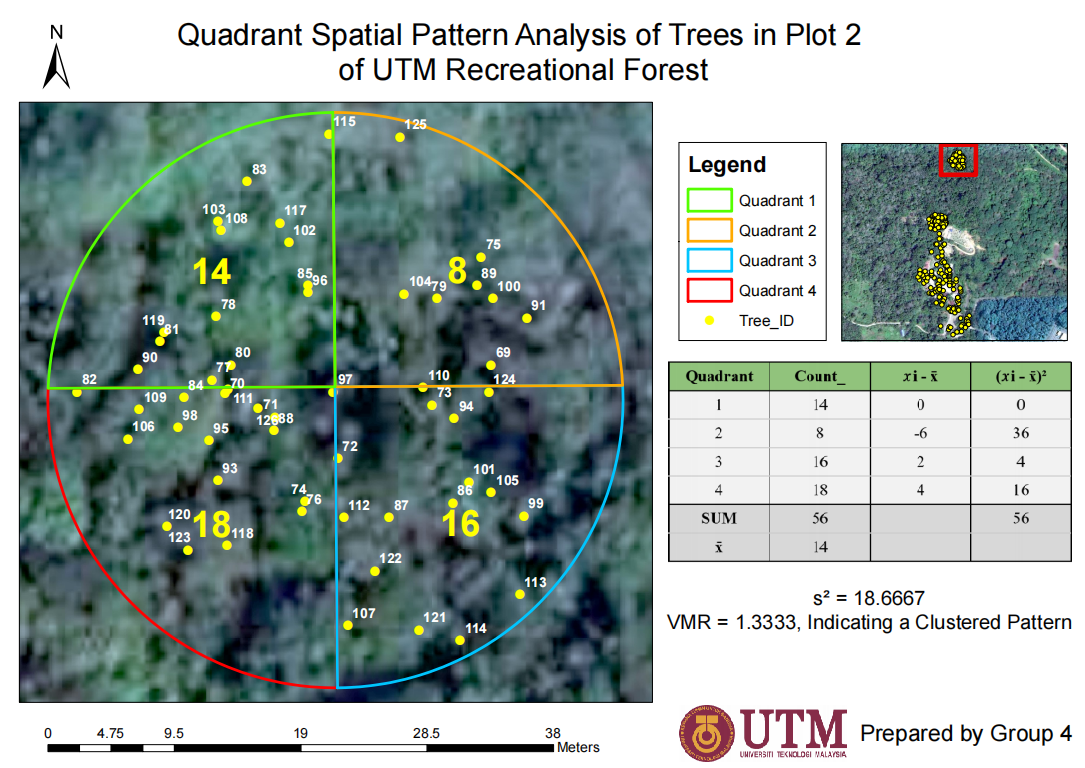
Quadrant Spatial Analysis of Trees in Plot 2
The result for Plot 2 is VMR = 1.333, which indicating a slight clustered pattern. This means the tree distribution may be affect by terrain, because low elevations may result in trees growing more easily and having higher density of trees, while slopes have fewer trees which result in lower density of trees.
Team
Great Minds Working Together
Muhammad Akashah Bin Ahmad Rosly
Project ManagerLeading collaboration and innovation in our project.

Nur Fatihah Binti Mohd Taib
Data AnalystDiscovering patterns and trends through GIS data.

Tan Qiao Ying
GIS AnalystExploring spatial data for better insights.
Contact
Contact UTM Recreational Forest.
Address
Hutan Rekreasi UTM, Jalan Arked Angkasa, 80990
Johor Bahru, Johor Darul Ta'zim
Call Us
07-553 0609